The computer scientist Claire Mathieu explains how graph theory can help model the propagation of Covid-19, and assess the relevance of several confinement scenarios.
You are proposing to use tools from graph theory to study the propagation of Covid-19. How did this project come to life, and what are its objectives?
Claire Mathieu: the CNRS management encouraged all staff members to make research proposals that could prove useful in the struggle against the virus. While discussing with my colleagues Laurent Viennot and Vincent Cohen-Addad last week, it occurred to us that our research on graphs could be of interest in studying the propagation of the disease in small communities, thereby shedding light on the implementation of deconfinement strategies.
What are graphs, and how are they connected to the propagation of epidemics?
C. M.: A graph is a network of points called nodes, which are connected by links. In the case of an epidemic, each node represents an individual at a particular stage of infection (healthy, infected, or recovered), and each link between two nodes illustrates a social interaction between two individuals. Taken together this provides a map of sorts for all social contacts within a group.
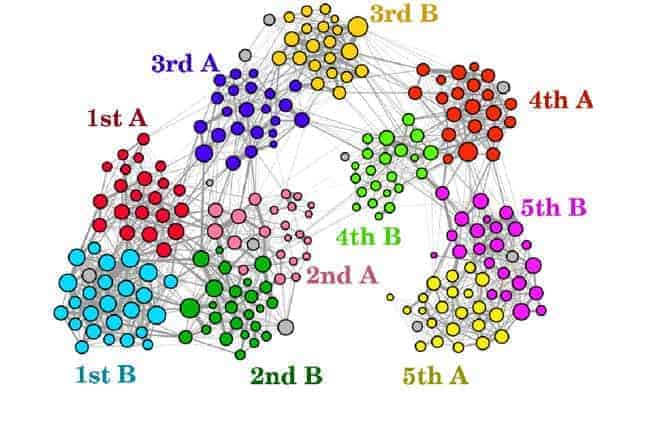
Graph recapping all of the contacts (lines) between teachers and students (coloured nodes) from different classes during the course of a day (the larger the dot, the more that person had contacts).
For example, the graph of social interactions in my neighbourhood during this period of confinement will show that I am connected to very few people, essentially my family and the sales assistants where I shop, while my baker’s activity means they are linked to a very large number of locals. We can then use this network to provide a probability for virus transmission during an interaction between two people in the network, which helps understand how the infection spreads within the population.
Using similar models, computer science researchers in the past have studied how best to disseminate information within a group. This in short revealed the importance of highly connected individuals, as well as those belonging to multiple communities at the same time. These people should be given preference in spreading information, and conversely should be the ones that are isolated first and foremost in order to contain an epidemic.
What does this type of model offer in comparison to those already used by epidemiologists?
C. M.: In general, the modelling of complex phenomena requires different simulations that are well-adapted to the various spatio-temporal scales under consideration. For instance, in the case of climate patterns, while the physics equations that describe a phenomenon on a very small level can be solved numerically, statistical representations are necessary for large scales, and yet other models are needed for intermediate ones. For the propagation of an epidemic, our proposal can be applied to the finest level of granularity, which is to say small communities and all of the links within them.
What precisely will this involve?
C. M.: As part of the “Soci-patterns” project, our physicist colleagues have released data collected in a primary school in 2011, which contains all of the interactions between students and teachers over the course of two days: who met whom, when, where, and for how long. The resulting dynamic graph includes approximately 250 nodes and hundreds of thousands of links. Its propagation properties can be analysed in order to explore different strategies for reopening schools.
Should they be opened part time? Should students be separated into different groups? If so, what would be the optimal size? Should children eat lunch in the classroom? Is it preferable for secondary school teachers to rotate from class to class, instead of their students? Rigorous quantitative analysis can help answer these questions.
We then plan to theoretically model interaction networks that are representative of various situations, which we can subsequently use to conduct similar analyses. It would be interesting to model the typical links within a family, school, or company, and to connect the corresponding graphs in order to understand the specific “pathways” travelled by the epidemic. This could shed light on the deconfinement scenarios being studied on the scale of a city or neighbourhood, by concretely indicating the most relevant links to keep inactive.

Representation of the movement of different classes in the school: each coloured line corresponds to a particular class, with its width being proportional to the number of students involved.
The French President announced that schools would reopen on 11 May. What is your opinion thereon at this stage of your research?
C. M.: It’s far too early for us to assert anything at all! We have to keep in mind that under normal circumstances, research requires at least six months before we can potentially draw our initial conclusions. In this case, we issued a proposal only ten days ago, and began work last week. That being said, researchers could play an advisory role with university vice-chancellors and school head teachers to prepare for 11 May, or for after the summer.
For that matter, suppose that in the next few weeks we find ourselves in a situation similar to the first epidemiological stage (except for those who have acquired immunity). It would then be necessary to isolate new individuals who are infected, and test their contacts in order to quarantine them where necessary, even before they themselves become contagious. Our approach could help determine priorities in this process. Indeed, while some links should obviously be severed, other more subtle ones could only be revealed through rigorous mathematical analysis.
Could your research results serve as input data to ‘feed’ epidemiological models on a larger scale, thereby making their predictions more accurate?
C. M.: Once again it is too early to answer, but it is a relevant question. More generally, I would like to emphasise that during this current period of uncertainty, all questions or remarks, regardless of where they come from, can contribute to reflection. With regard to schools, graphs will perhaps provide answers, but it will also be very interesting to consult head teachers, teachers, and parents. For example, let’s assume that our models suggest that from a strictly epidemiological point of view, it is preferable to separate good friends, in order to eliminate the links with the highest probability of transmitting the virus. Is this truly desirable from a school’s organisation perspective? It is not up to me to answer, but what I do know is that within a network formed by society – all the more so when it comes to complex questions that require swift answers – the circulation of information and experiences that can feed the debate should involve actors from as wide a variety of backgrounds as possible!