Together with Olivier Ertz,1 from the Media Engineering Institute in Switzerland, you joined the Open Geospatial Consortium (OGC) in an effort to create a new international cartographic standard. To understand the core issues of your work, can you explain what a map is conceptually, and what is expected of it?
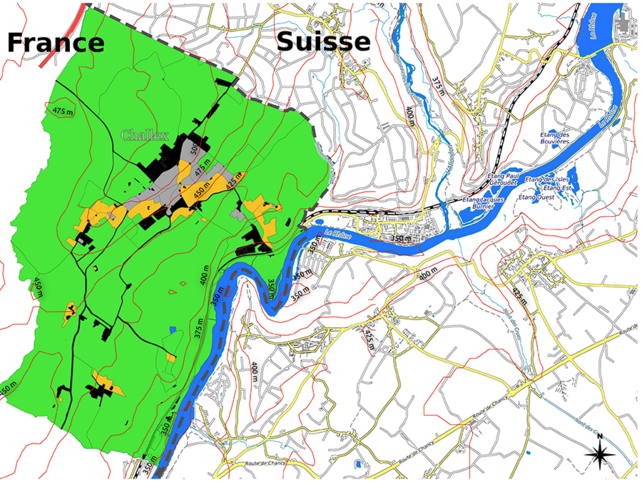
Erwan Bocher:2 A map is an object that transcribes facts relating to a territory (topography, population, temperature, sea level, etc.), through a process of abstraction that transforms data from the real world into a series of symbols placed on a medium representing that territory. We expect maps to be the most faithful possible representation of this information, enabling us – provided we know how to read them – to grasp the geographic organisation of a territory at a glance. However, when it comes to helping decision-making, a map also conveys messages. For instance, the appropriate use of colour makes it possible to represent the concentration of a pollutant in the air, so that areas where a certain threshold is exceeded are displayed clearly.
This transformation of data into relevant symbols is the key issue in a cartographic standard, is that correct?
E. B.: Absolutely. It is what we call a standardised common language of configurable symbolic elements, which are assembled to create a cartographic representation. When applied to data, the standard can produce a map that visualises this data in space.
You subsequently proposed a new generic standard for cartography?
E. B.: Indeed. With Olivier Ertz, a professor of geoinformatics, we conducted a theoretical reflection to redefine the current standard, with a view to making it not just more graphically expressive, but also more scalable and usable by all of the communities concerned by cartographic interoperability. In fact, we completely rethought how a map is built and shared.
What exactly was the problem with the current standard?
E. B.: Before we go any further, let’s look back in time. Prior to the advent of the Internet, in the early 2000s, each community (geologists, climatologists, epidemiologists, etc.) had access solely to their own geographic information. The data was not pooled, and there was no real infrastructure or formats for sharing it. As a result, each group developed their own maps. However, new and widely-available information and communication technologies radically transformed the processing and rendering of geographic information, henceforth enabling broad data sharing within spatial data infrastructure (SDI). A vast undertaking to gather geographic information began, largely encouraged by the OGC.
Mutualising and sharing resources is indeed extremely useful for generating knowledge. Whether for researchers or institutions, the ability to pool data emerged as one of the necessary conditions for improving territorial governance, as well as proof of the effectiveness and transparency of public action. In this respect, a telling example is the European Directive Inspire, which established a framework to make public geographic information – environmental in particular – available to all. Concretely, the main actors in the world of geography came together, leading to the creation of the first cartographic servers for the sharing of geodata, such as that of the French National Institute of Geographic and Forest Information (IGN).
It is these “geo-platforms” that are based on a standard?
E. B.: Exactly, and even on numerous geostandards, such as those that make it possible to navigate a territory in the form of interactive maps, using Web mechanisms that are also standardised. More precisely, the geostandard we are concerned with is known as SymCore. It lays the foundation for defining the rules based on which data is transformed into symbols.
So what was the problem?
E. B.: I’ll give you an example. In 2010, I coordinated a project for a scientific platform that pooled together urban geographic data, especially environmental data, such as weather, noise, pollution, etc. While we were able to use adequate and regularly updated international standards to discover and share information through geographic services, we realised that map sharing standards were not quite suited to our needs, and in particular that they were no longer evolving.
How was that?
E. B.: There are plenty of “map sharing” examples. In simple terms, imagine you want to combine the representation of the wastewater networks of two separate municipalities (called X and Y) on a single map. If this is rendered with a thin brown line by the cartographic server for X and a purple line and symbols by the server for municipality Y, assembling the two maps will result in a non-matching visual composition, which will cause confusion with other cartographic elements. This shows that it is useful to have a common language for cartographic representation, in order to navigate one or more servers of an SDI, based on a personalised description – or one defined by a community of users for a specific type of data (networks, weather, noise).

The richness of the language becomes important, as it is linked to its capacity to evolve. While the geographic creativity of various communities of users is actually quite impressive, the current standard’s possibilities, admittedly, are fairly basic, thus limiting representations, especially with regard to thematic cartography. Things are no better in terms of evolution, with unilateral initiatives on the part of companies to expand their capacities. The intention is there, especially in terms of satisfying clients, but it undermines the very principle of interoperability, and hence the possibility of “map sharing” between different tools.
What approach did you take?
E. B.: We felt that it was essential to begin by setting aside all technical considerations, in order to concentrate exclusively on the theory for using visual variables. With one overarching question: “how to build a common foundation for an evolving standard, while providing a language that can inscribe these variables in its grammar?” To do so, we relied on geographer Jacques Bertin’s research in graphic semiology, which is the science of the graphic representation of data. Before him, a good rendering had to essentially be precise and complete. He placed emphasis on the effectiveness of communication, closely analysing all parameters that contribute to transforming information into a visual depiction, ranging from the capacities of the human eye to the possibilities offered by the written form. Basing himself on this analysis, he then proposed a series of visual variables that, when combined, make it possible to build maps. From our perspective, it was a matter of reconceptualising an existing standard (OGC Symbology Encoding) in compliance with these semiological concepts.
Is it very abstract?
E. B.: The idea is to start by applying a cartographic style to the data, one that contains all the descriptors that can represent it, including dots, lines, surfaces, colours and textual elements. In its current state, what is new in our proposal is known as Symbology Conceptual Core Model (SymCore). It conceptually defines a series of extension points for cartographic primitives, which when used by different communities, provide a common language for building maps. When used ahead of the chain of production, it provides a vocabulary and common referents that can create universal libraries of cartographic styles, with a view to facilitating graphic interoperability between software programs, and hence between users.
How was this academic work perceived?
E. B.: Following our assessment, we turned to the OGC to make it a reality, and proposed to coordinate this reflection. The publication in the journal PeerJ Computer Science3 presented the issues at stake and our approach. At first there was no real consensus: we had to be convincing! In a world of engineers and major publishers, who are more accustomed to approaching a problem from a technical point of view, we had to engage in a pedagogical effort.
How did you convince people of the need to revisit the geographic standard in accordance with your recommendations?
E. B.: We first had to reframe the underlying needs. For example, in late 2017 a large consortium involving the US and Canadian governments decided to proceed with a geographic platform project that would synthesise all of the data on the Arctic. Yet just as we did in the field of urban data, their experts realised that it was impossible to propose complex representations using the current standard. So they turned to the OGC and found out about our work. As a result, a report from late 2018, supported by the Canadian Ministry of Natural Resources and the US Army Geospatial Center, confirmed the relevance of our approach!
Leading to the acceptance of your work.
E. B.: After years of self-financed work, the new standard SymCore was finally published in the autumn of 2020, this time enjoying broad consensus. It was the result of months of discussions with actors in geomatics at the OGC, and of two distinct calls for comments, in the course of which we responded point-by-point to all questions asked, taking into consideration the final requests for improvement submitted by the international community.
Can we expect a revolution in the world of cartography?
E. B.: Rather a new start, with a long-term vision. The various communities involved in cartography should make it their own and use it as a foundation to build the cartographic primitives they need – preferably doing so in consultation – to achieve a system of representation that transcends the different disciplines. With this goal in mind, it is also crucial to convince important publishers and the software industry to make this vision come true. This phase appears fairly advanced today, with the creation within the OGC of a new working group named Portrayal DWG, led by the US Army Geospatial Center and the Defence Science & Technology Laboratory (DSTL).
How will you contribute to this crucial stage?
E. B.: In parallel with our conceptual research, we initiated a testing phase for our standard, in an effort to concretely show what it can do. More precisely, we produced a reference implementation on www.Orbisgis.org, a research platform we had used to develop a collaborative program for noise mapping, which in a sense was already a test of this new standard, with a few concrete symbology extensions. We will build on this effort to guide the new working group, although this cannot be achieved without financial support, as much remains to be done.
What is at stake?
E. B.: This work confirms the CNRS as a research partner whose knowledge can contribute to standardisation in the field of international cartography. We hope to maintain this dynamic by initiating research programmes to this end, and by bringing together scientific disciplines ranging from geography to computer science. We must step up our activities and secure funding, for without maps, geographic data means nothing!
- 1.Olivier Ertz is a professor at the Media Engineering Institute of the School of Management and Engineering Vaud (HES-SO, Switzerland).
- 2.Erwan Bocher works at the Laboratoire des sciences et techniques de l’information, de la communication et de la connaissance (Lab-STICC – CNRS / ENIB / Université de Bretagne Sud / Université de Bretagne occidentale / Ensta Bretagne / IMT Atlantique-Institut Mines-Télécom).
- 3.Bocher, E. and Ertz, O. 2018. “A redesign of OGC Symbology Encoding standard for sharing cartography”, PeerJ Computer Science, 4:e143. https://doi.org/10.7717/peerj-cs.143

