As reported in a ScienceBlog post dated Jan. 7, 2021, in 2020, due to the lockdowns connected with the coronavirus pandemic, this caused emissions of carbon dioxide in the atmosphere to drop by seven percent.
The dip is temporary as atmospheric carbon dioxide levels are expected to bounce back to 2019 levels when the economy itself rebounds to its pre-pandemic state. The news of the reduction in atmospheric carbon dioxide concentration contributed by fossil-fuel burning is most welcome.
A big contributor to the decline, of course, is less driving and, correspondingly, less fuel consumption as a result.
Meanwhile, the average fuel-economy rating for light-duty vehicles in the United States fell from 25.1 miles per gallon (mpg) for Model Year (MY) 2018 light-duty vehicles (LDVs) to 24.9 mpg for MY 2019 LDVs – a decrease of 0.2 mpg, so-noted the U.S. Environmental Protection Agency (EPA) its Jan. 6, 2021 “Agency Releases Annual Automotive Trends Report Showing Manufacturers Still Struggling to Comply with Obama Era Standards Without Use of Credits,” news release. It would definitely not bode well should this reflect the shape of things to come.
The EPA further in the release pointed to the fact that “Since MY 2004, when the fleet averaged 19.3 mpg, fuel economy, and CO2 emissions have improved in twelve out of fifteen years.”
Now, two items to look at are: What’s behind the worsening trend and, quantitatively speaking, in regards to tailpipe CO2 emissions output how much of a difference does a 0.2 mpg LDV fuel-economy deficit actually make?
Behind those disappointing numbers
Indications are that due to the market share of sport utility vehicles reaching a record high, this is what contributed in 2019 compared with 2018 to LDVs on average being less fuel-efficient. If, in fact, this is the case, this would explain the higher amount of carbon dioxide in air.
Key numbers to consider
For starters, cumulative vehicle travel miles in the U.S. went from 3.240327 trillion for all vehicles to 3.269088 trillion in 2019, an increase of 28.761 billion traveled miles. In 2018, light-duty vehicles travel miles accounted for 89.4 percent of the aggregate total by all on-road vehicles. This being the case means that of the total 3.240327 trillion VMT in 2018, light-duty vehicles accounted for approximately 2.896852 trillion VMT.
Assuming the same 89.4 percent figure also holds true for year 2019 (the percentage for 2017 was 89.6), then U.S. light-duty vehicle driving totaled 2.922565 trillion miles – a difference of 25.713 billion miles or an increase of 3.3 percent, 2019 over 2018.
Now, for an LDV average mpg fuel economy of 25.1 in 2018, 115,412,430,279 (115.412430 billion) gallons of gas is needed to drive that total 2.896852 trillion miles. And, with the understanding that 19.64 pounds of carbon dioxide is released into the atmosphere for every gallon of gasoline burned, total CO2 contribution from all of that driving in 2018, comes out to 2.2667 trillion pounds or 1.1334 billion tons.
Meanwhile, for an LDV average mpg fuel economy rating of 24.9 in 2019, required to drive the total 2.922565 trillion miles that year, is 117,372,088,353 (117.372088 billion) gallons of gas and from this 2.305188 trillion pounds or 1.1526 billion tons of CO2 is pumped into the atmosphere.
Therefore, based on that 0.2 mpg LDV fuel economy difference alluded to above, the gain in atmospheric CO2 2019 over 2018 released into the air is an additions 19.244 million tons or an increase of 1.694 percent.
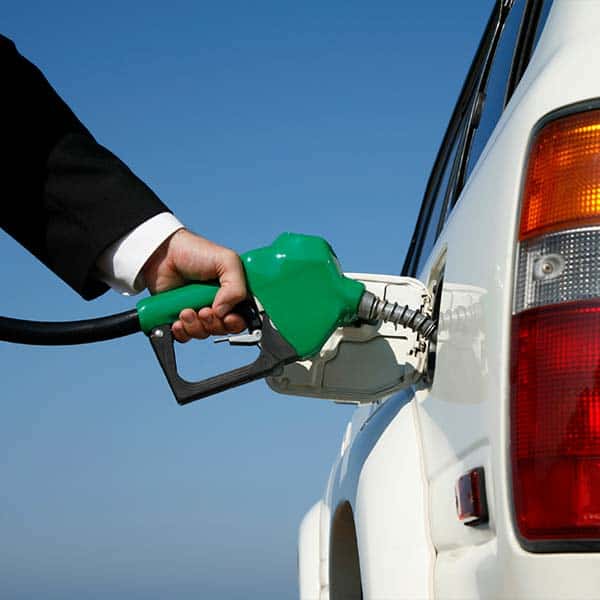
Image above: Copyright © 2020 Environmental Defense Fund. The original material is available at: https://www.edf.org/federal-clean-car-standards
Published by Alan Kandel


