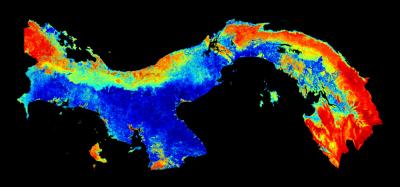
A team of researchers has for the first time mapped the above ground carbon density of an entire country in high fidelity.
They integrated field data with satellite imagery and high-resolution airborne Light Detection and Ranging (LiDAR) data to map the vegetation and to quantify carbon stocks throughout the Republic of Panama. The results are the first maps that report carbon stocks locally in areas as small as a hectare (2.5 acres) and yet cover millions of hectares in a short time. The system has the lowest demonstrated uncertainty of any carbon-counting approach yet—a carbon estimation uncertainty of about 10% in each hectare overflown with LiDAR as compared to field-based estimates. Importantly, it can be used across a wide range of vegetation types worldwide.
The new system, described in Carbon Balance and Management, will greatly boost conservation and efforts to mitigate climate change through carbon sequestration. It will also inform our understanding of how carbon storage can be used to assess other fundamental ecosystem characteristics such as hydrology, habitat quality, and biodiversity. The approach provides much-needed technical support for carbon-based economic activities such as the United Nations Reducing Emissions from Deforestation and Forest Degradation (REDD) program* in developing countries.
Panama has complex landscapes, with variable topography, and diverse ecosystems (ranging from grasslands and mangroves to shrublands and dense forests). As a result, Panama is an ideal laboratory to develop and test a method for quantifying aboveground carbon.
Lead author Greg Asner commented: “Three things make this national-scale study unique. First, Panama is an outstanding place for testing carbon mapping approaches due in part to the long-term forest studies that have been undertaken by our partners at the Smithsonian Tropical Research Institute (STRI). Second, we have applied the very latest techniques using high-performance instrumentation, resulting in demonstrably high accuracy at fine spatial resolution. And third the partnership permitted us to estimate our errors in a novel way, and we did so over every point on Panamanian soil.”
In addition to Carnegie and STRI researchers, scientists from McGill University and UC-Berkeley combined measurement methods—an extensive and essential network of ground-based plot sampling, satellite imagery, and LiDAR measurements from the Carnegie Airborne Observatory—to achieve the unprecedented accuracy.
LiDAR uses reflected laser light to image vegetation canopy structure in 3-D. The scientists calibrated the LiDAR measurements, taken at one-meter resolution throughout nearly one million acres (390,000 hectares), to the carbon density in 228 regional field plots, established and sampled by the collaborating scientists. They used 91 other plots to validate the LiDAR’s aboveground carbon density estimates.
“Rarely has such a large number of field plots been available to validate LiDAR calibration independently,” remarked Asner. “Our collaboration with STRI and its partners was vital to assess the accuracy of what we achieved from the air.”
Traditional carbon monitoring has relied upon on-the-ground sampling of field plots, but this approach usually represents just small areas of land and is time-consuming. “There has been growing interest in using satellite imagery to cover larger areas, but it is low resolution both spatially and in terms of the structural information about the vegetation,” described Carnegie author Joseph Mascaro. “In some parts of Panama, different global methods disagree by more than 100% at square-kilometer scale.”
That’s where the airborne LiDAR comes in. It directly probes the ecosystem’s physical structure, which Carnegie scientists have repeatedly proven to be tightly linked to tropical carbon stocks. These measurements are the bedrock for mapping and estimating the amount of carbon locked up in plants from dense forests to shrublands.
The researchers then were able to scale up the plot and LiDAR data with freely available satellite data on topography, rainfall and vegetation to model carbon stocks at the national level.
The LiDAR and satellite combination were able to account for variations in the carbon pattern from differences in elevation, slope, climate, and fractional canopy cover over the entire country. For instance, the scientists found that highest carbon levels are in humid forests on the Caribbean side of Panama, often exceeding 110 tons of carbon per hectare (2.5 acres). In contrast, large regions were deforested to very low carbon levels, such as in the developed regions outside the protected watershed of the Panama Canal. Human activity is the overwhelming driver of carbon stock patterns in Panama.
“Panama is one of the first UN REDD partner countries, and these new maps put the country at the forefront of high-resolution ecosystem management.” said co-author and STRI’s director Eldredge Bermingham, “The new carbon mapping approach could be the model for other tropical nations.”


