This is a story of pure math — not what I usually write about — but this story captured my imagination yesterday as I was playing with a simple three-line computer program. The result presented a puzzle that requires only high school math to understand, but has no easy answer.
(I presented the puzzle to Grok this morning, and Grok gave me gibberish as an explanation. Grok retreated when I pointed out that its explanation didn’t hold water.)
Start with the well-known fact that 22/7 is a good rational estimate for π.
22 / 7 = 3.142857…
π = 3.141592…
You might ask, “how big do the numbers have to get before you have a better estimate than 22/7? The answer is 179 / 57 = 3.140350…
Generalizing, we might formally define “good rational estimate” in the natural way — it’s the ratio of two numbers that gives a closer approximation to π than any smaller integers.
Hold that thought and skip to the Golden Ratio
The next step in appreciating the math puzzle is to ask about good rational estimates for the Golden Ratio, φ = 1.61803… The answer is
2 / 1 = 2.0
3 / 2 = 1.5
5 / 3 = 1.666…
8 / 5 = 1.6
13 / 8 = 1.625
21 / 13 = 1.61538…
You recognized these numbers immediately as Fibonacci numbers. This is no accident. A common definition of Fibonacci numbers is that each is the sum of the last two. If you see that the ratio of successive Fibonacci numbers is approaching a limit, you can write an equation for what that limit must be:

where A is any Fibonacci number, B is the next one, and B+A is the next one after that. Now define φ = B/A, cross multiply and this equation turns into a quadratic equation for φ. You can solve that equation with the quadratic formula and find

How closely spaced are the good rational estimates?
If I think like a statistician, I would say that getting closer to φ becomes “exponentially more difficult” in a loose sense of the words. What I mean is that if I already have φ approximated to 3 digits and I want to do better than that, I’m looking at odds on the order of 1 in 1,000 that the numbers happen to work out. But then if the estimate is good to 4 digits, I face 1/10,000 odds in finding a better pair of numbers. So, just based on statistics, I would guess that the denominators in the fractions rise approximately exponentially.
And, of course, we just saw that in the case of the golden ratio φ, the successive good estimate denominators are each about φ times bigger than the last one, so they are increasing exponentially.
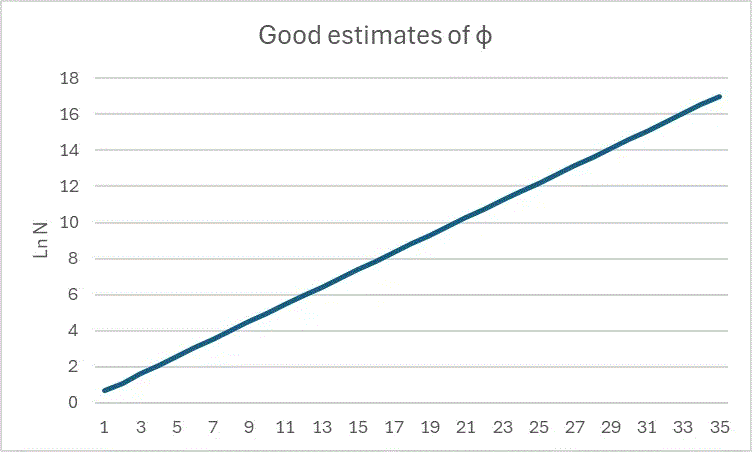
If we plot the denominators on a log scale, it looks like this. These are the first 35 Fibonacci numbers.
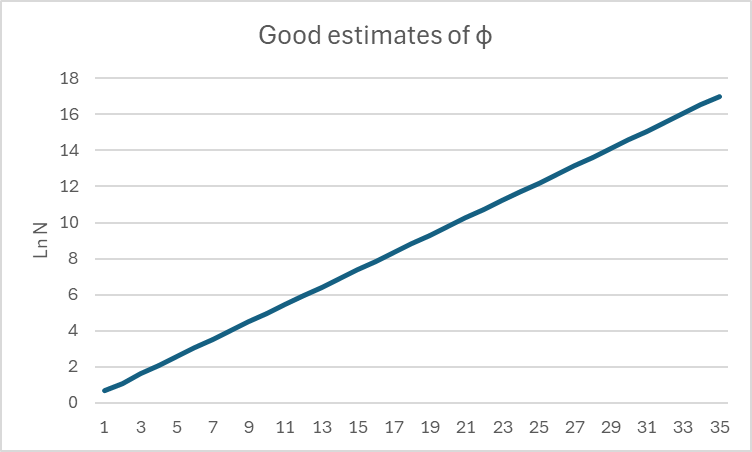
The exponential curve comes out a straight line on this log plot. The slope of the line is the log of φ = 0.481, meaning that each denominator is approximately φ times bigger than the previous one.
The statistical argument suggests that the good estimates should increase exponentially for any (irrational) number. We could ask for the first 35 denominators in good estimates of the number e=2.7182845…
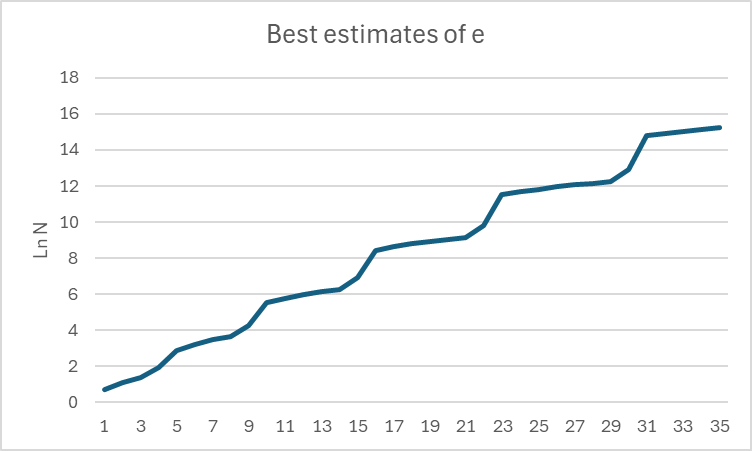
The line is a little more wobbly, but clearly it is increasing exponentially in the long run. The slope in this case is 0.436, a little smaller than the slope for φ.
Let’s do the square root of 10, which is quite close to π.
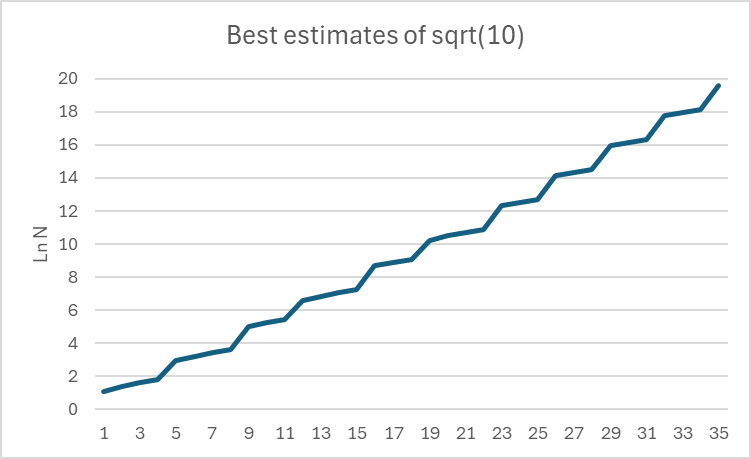
Again, it’s a wobbly line with a constant slope. In this case, the slope is 0.540, a little steeper than the slope for φ.
I understand generally why the log plots are approximately straight lines, but I don’t understand why the slopes are what they are in each case, and I don’t understand the regularity of the wobbles, or the fact that there is practically no wobble in the plot for φ.
Now we’re ready for the puzzle
Yesterday, the first case I ran was for π, and the result surprised me. The good approximations are much closer together, especially as you get up past 10,000. In fact, I was only able to do about 35 cases for all the above targets before the numbers got too big for the way the computer language stores integers. But for π, I could go much further. This is what the log plot looks like:
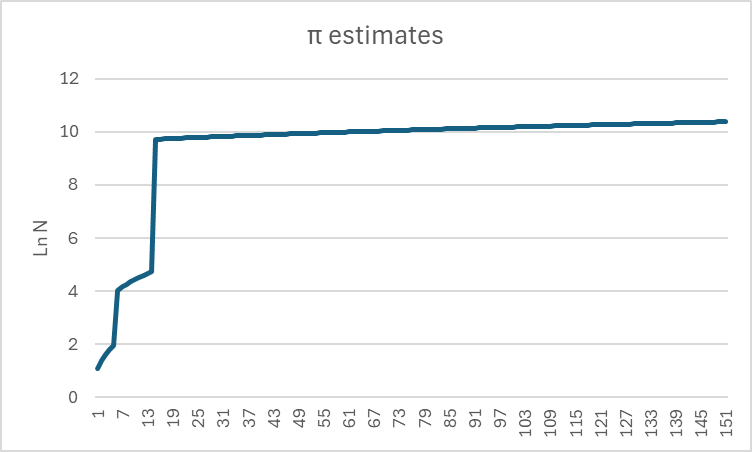
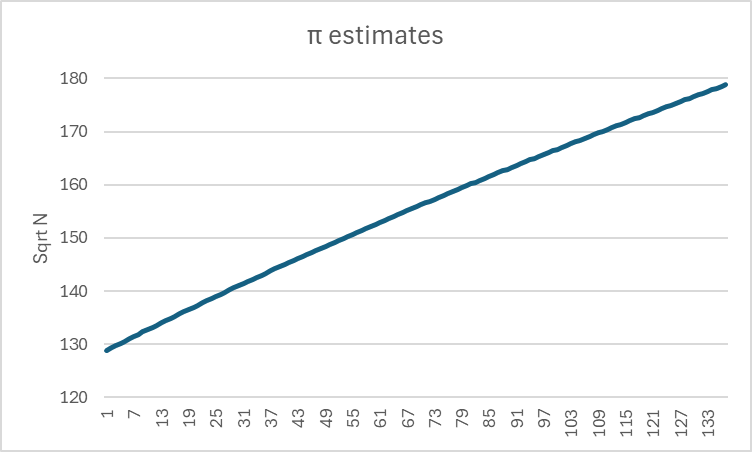
Clearly the numbers are not increasing exponentially. In fact, they seem to be in 5 different regimes, and each regime is approximately quadratic. Here is a plot of the denominators starting at the first 4-digit number. Instead of plotting the log, I have plotted the square root.
So, dear reader, why is our statistical expectation met for all the irrational numbers we tried except π? Why is the density of good estimates for π so much higher than for any other irrational number?
I think I have an idea why this is true. I don’t have ideas about how many more numbers there are that behave like π, or why the slopes are what they are, or why the plots (except for φ) jog with semi-regular steps.
I’m interested that Grok did so badly with these questions, and I expect your comments will be much more intelligent.