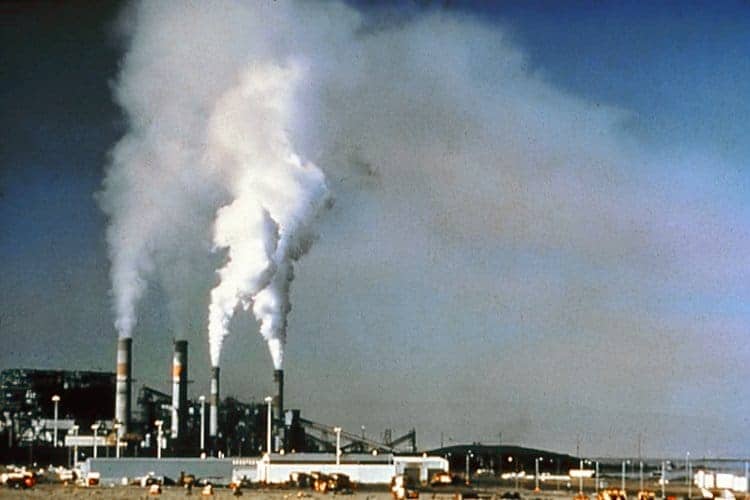
Delhi, India is in the throes of a really bad episode of smog right now. That’s most unfortunate. The south Asian country has some of the worst air on the planet.
On the other hand, there are other places where the air is pristine clean. I would think the cleanest of the clean locations for air, would have to be both the Arctic and Antarctic regions, but do correct me please if I am wrong. The problem with such is that relatively few people live or go to either of those to take advantage, which sort of hints at the notion that places with small populations, relatively speaking, would be among all places that have clean air.
That settles that.
Next, a useful way to determine if air in the world is getting cleaner or dirtier in general, like in the case of the coronavirus disease, is to assess the rate of mortalities per 100,000 people. If the numbers of mortalities per 100,000 are increasing, what this would tell a person is that air pollution is becoming more problematic, more burdensome. On the other hand, it is safe to say that, if the number of mortalities per 100,000 people is decreasing, then pollution in the air is less problematic, less burdensome. And this is true whether or not the overall numbers of mortalities are increasing or decreasing. As before, correct me please if I’m wrong.
So, what about the notion of carbon dioxide (and other greenhouse gases) as it has to do with its concentration in the air being on the rise, a level that now has exceeded 410 parts per million (ppm) on average, up from somewhere around 270 ppm at around 1750, that year or thereabouts the Industrial Revolution came into being? At the same time, does this not hint of fossil-fuel-burning activity being on the upswing, also? And, if this is the case, then if one were to think world air quality would be on the mend, well, that thinking would be most counterintuitive.
It is also important to consider that in the United States, standards – referred to as National Ambient Air Quality Standards – for ozone (O3) and fine particulates (PM2.5) have, over time, become more stringent or health protective as it were, depending upon how you look at it.
Take, for example, either ozone of fine particulate matter, if in the case of the former, the threshold between good and bad air is at a level or concentration in air of 70 parts per billion (ppb), and this relates to ozone measured over an 8-hour period during a 24-hour cycle – so, a third of the time or a third of the day, in other words. Such corresponds to the 100/101 separation line on the Air Quality Index or AQI. The same for PM2.5, the difference here being that the threshold for this pollutant is 35 micrograms per cubic meter of air, this corresponding also to the 100/101 AQI separation line. Go above, and the air is considered to be unhealthy. Stay below and the air could be good or moderate, depending.
But here’s the rub. The values for what is considered borderline moderate/unhealthy has changed – it has not remained the same. What was once considered moderate, might today be deemed unhealthy, albeit unhealthy for sensitive individuals but unhealthy nonetheless.
Take a sporting event like football. Equating such to a more stringent health standard, well, that’s like moving the goal posts back or lengthening the playing field. And, whether by touchdown or field goal, harder therefore, it is to score. And, by virtue of the tighter health standards, what this in essence tells us is that compared to the earlier times I alluded to above, such corresponds to a worsening air quality condition, attributed to the simple fact that more regions would become non-compliant.
I believe I am not wrong in my evaluation of this situation. But like I said twice previously, if I’m off base, then I welcome correction.

Images: United States National Park Service (NPS) (upper); Gary Halvorson, Oregon State Archives (lower)
– Alan Kandel


