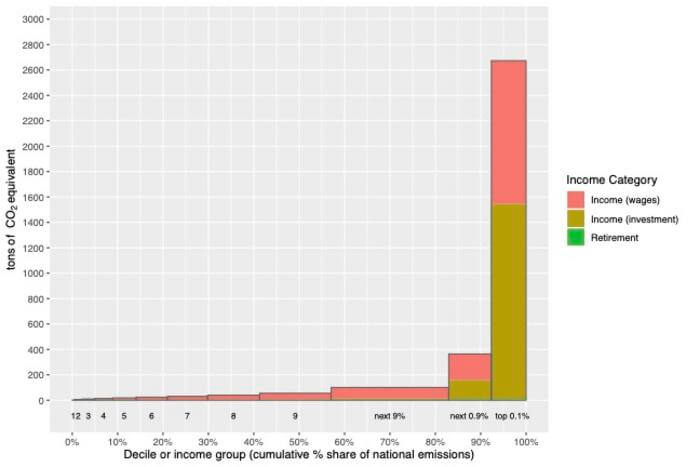
AMHERST, Mass. – A new study, led by the University of Massachusetts Amherst, reveals that the wealthiest Americans, those whose income places them in the top 10% of earners, are responsible for 40% of the nation’s total greenhouse gas emissions. The study, published in PLOS Climate, is the first to link income, especially income derived from financial investments, to the emissions used in generating that income. The authors suggest that policymakers adopt taxes focused on shareholders and the carbon intensity of investment incomes in order to equitably meet the goal of keeping the global temperature to 1.5 C of warming.
Scientists and environmentalists have long known that consumption—the amount and kind of food we eat, the vehicles we drive and all the stuff we buy—is closely linked to greenhouse gas emission. Traditional environmental policy has then sought to either limit consumption or guide it into more environmentally friendly avenues: replacing red meat with plant-based diets or swapping a gas-guzzler for an electric vehicle.
“But,” says Jared Starr, a sustainability scientist at UMass Amherst and the lead author of the new study, “consumption-based approaches to limiting greenhouse gas emissions are regressive. They disproportionately punish the poor while having little impact on the extremely wealthy, who tend to save and invest a large share of their income. Consumption-based approaches miss something important: carbon pollution generates income, but when that income is reinvested into stocks, rather than spent on necessities, it isn’t subject to a consumption-based carbon tax.”
“What happens,” Starr asks, “when we focus on how emissions create income, rather than how they enable consumption?”

An answer to that seemingly simple question, however, is fraught with difficulty, because though it’s relatively easy to capture a snapshot of wages and salaries—the main sources of income for 90% of Americans—it has been very difficult to get a sense of the investment income that makes up a large source of the richest Americans’ wealth.
To solve this problem, Starr and his colleagues looked at 30 years’ worth of data, drawing first on a database containing over 2.8 billion inter-sectoral financial transfers and following the flow of carbon and income through these transactions. This allowed them to calculate two different values: supplier-based and producer-based greenhouse gas emissions of income.
Supplier-based emissions are those created by industries that supply fossil fuels to the economy. For instance, the operational emissions released by fossil fuel companies are actually quite low, but they make enormous profits by selling oil to others who will burn it.
Producer-based emissions are those directly released by the operation of the business itself—like a coal-fired power plant.
With these two figures in hand, Starr and his co-authors then linked their emissions data with another database containing detailed demographic and income data for over 5 million Americans. This database parses out income sources differentiating active income—the wages or salaries earned through employment—from the passively generated investment income.
Not only did the team find that over 40% of U.S. emissions were attributable with the income flows of the top 10%, they also discovered that the top 1% of earners alone generate 15 – 17% of the nation’s emissions. In general, white, non-Hispanic households had the highest emission-linked income and Black households the lowest. Emissions tended to increase with age, peaking with the 45–54 age group, before declining.
The team also identified “super emitters” with extremely high emissions intensity. These are almost exclusively among the top 0.1% of households, which are overrepresented in the fields of finance, real estate and insurance, manufacturing, and mining and quarrying.
“This research gives us insight into the way that income and investments obscure emissions responsibility,” says Starr. “For example, 15 days of income for a top 0.1% household generates as much carbon pollution as a lifetime of income for a household in the bottom 10%. An income-based lens helps us focus in on exactly who is profiting the most from climate-changing carbon pollution, and design policies to shift their behavior.”
In particular, Starr and his colleagues point to income and shareholder-based taxation—rather than taxing consumables.
“In this way,” says Starr, “we could really incentivize the Americans who are driving and profiting the most from climate change to decarbonize their industries and investments. It’s divestment through self-interest, rather than altruism. Imagine how quickly corporate executives, board members and large shareholders would decarbonize their industries if we made it in their financial interest to do so. The tax revenue gained could help the nation invest substantially in decarbonization efforts.”
Contacts: Jared Starr, [email protected]
Daegan Miller, [email protected]
Jared Sharpe, [email protected]


