

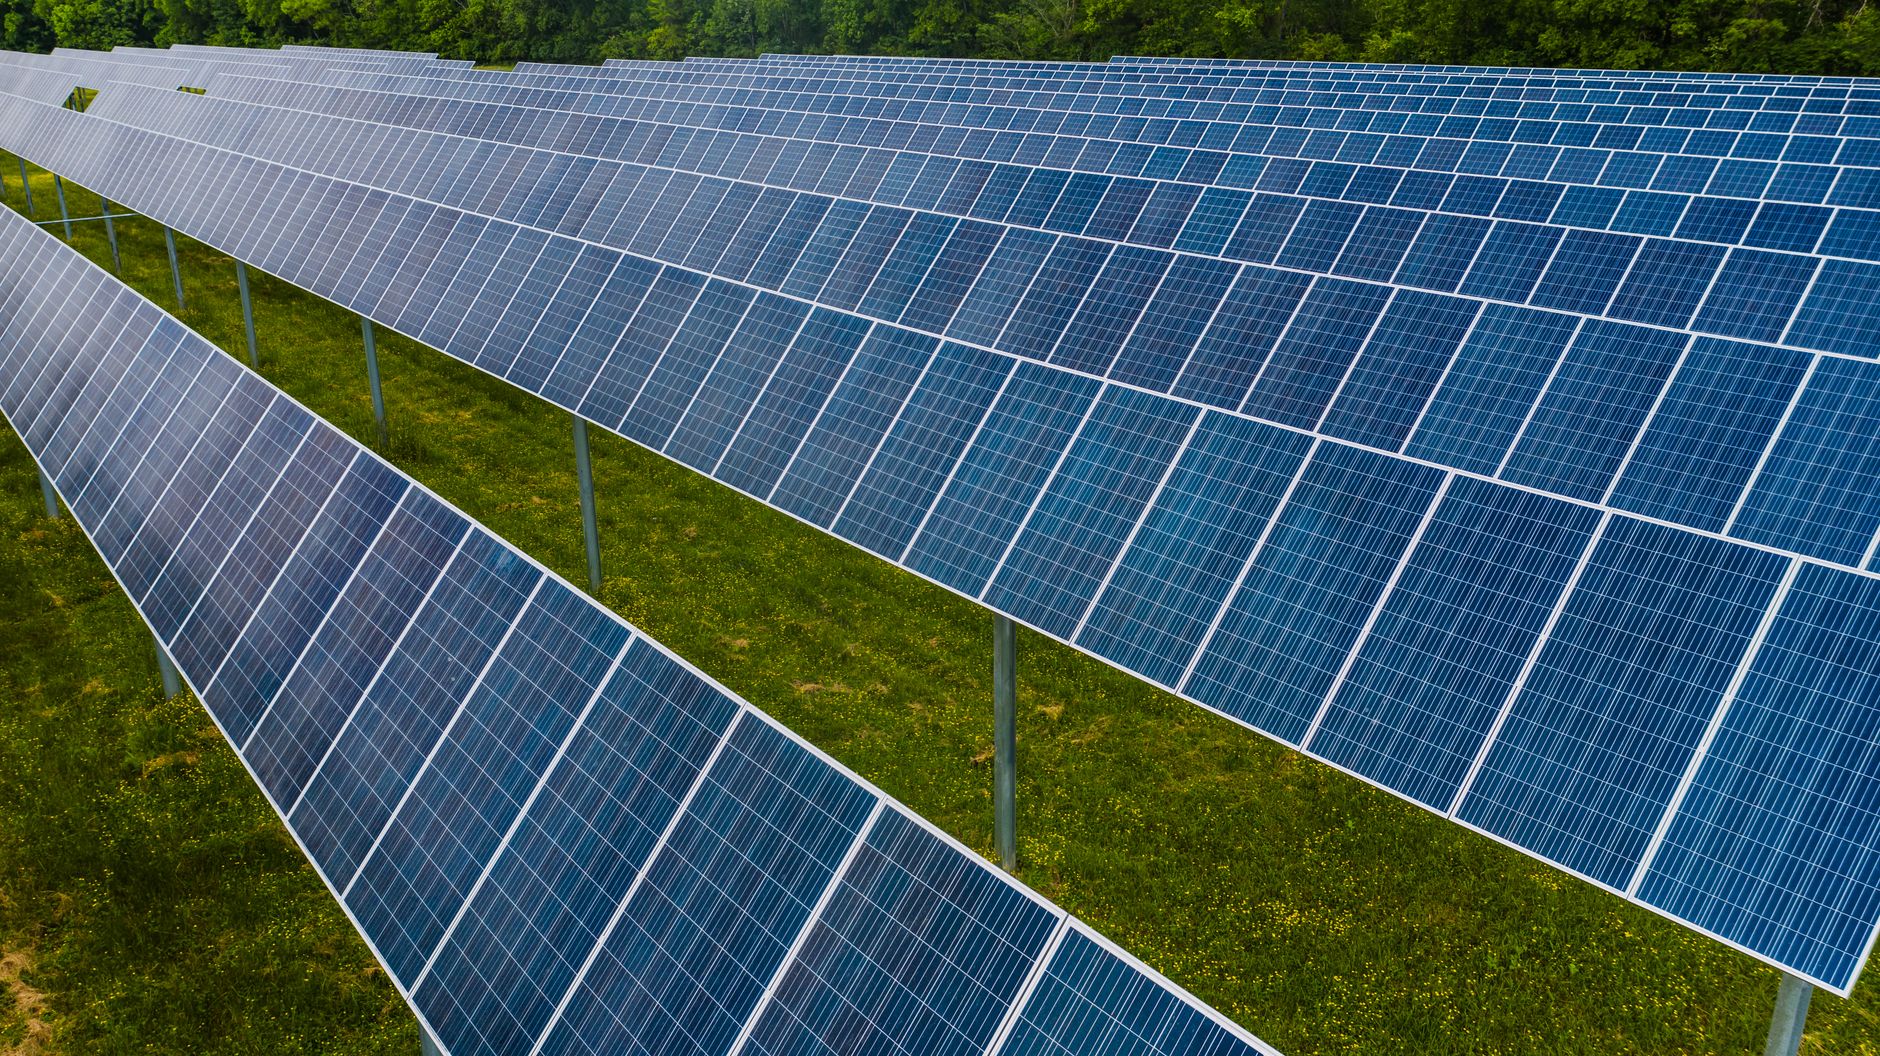
Solar photovoltaic generation increased by about 600 terawatt-hours worldwide in 2025. According to the International Energy Agency, that was the largest annual increase ever recorded for any electricity source, apart from unusual rebounds after global economic shocks.
Total solar generation reached nearly 2,700 terawatt-hours, more than double its 2022 output and enough to supply over 8 percent of global electricity. The scale matters. Solar is no longer a marginal technology whose main scientific question is whether it can produce meaningful amounts of power.
The harder question is increasingly what happens when vast numbers of panels produce electricity at the same time.
What the 600-terawatt-hour increase measures
The figures come from the IEA’s Global Energy Review 2026. They refer to electricity generated during 2025, not the nameplate capacity of newly installed panels.
That distinction is important. A solar farm’s capacity describes its maximum output under specified conditions. Generation is the electricity it actually produces over time, after accounting for night, clouds, seasons, equipment performance and any power that the grid cannot accept.
The IEA estimated that solar growth supplied more than one-quarter of the increase in global primary energy demand in 2025. Solar generation rose by at least 20 percent in China, the United States, India and the Middle East. For the first time, the agency described a modern renewable source as the largest contributor to growth in global energy supply.
These are estimates assembled by one international agency from national and sector data, not meter readings collected by a single global operator. Numbers may be revised as reporting improves. The result is still large enough that modest revisions would not change the underlying direction.
Manufacturing energy is real, but it is repaid quickly
A solar panel does not emerge without an environmental cost. Mining and refining materials, producing polysilicon, manufacturing cells and glass, transporting components, building support structures and handling equipment at the end of its life all require energy.
The useful measure here is energy payback time. It asks how long a system must operate before generating the amount of energy consumed across its manufacturing, installation, operation and end-of-life processes. This is different from financial payback, which depends on local electricity prices, financing, taxes and policy.
A 2024 life-cycle assessment led by Brittany Smith at the National Renewable Energy Laboratory modeled modern, utility-scale silicon solar systems in the United States. Across six combinations of manufacturing supply chain and installation location, the estimated energy payback time ranged from 0.5 to 1.2 years. The analysis assumed a 30-year operating life.
The range reflects physical differences that broad claims about “a solar panel” can hide. A system installed in sunny Phoenix produces more annual electricity than the same equipment in Seattle. Panels manufactured with a lower-carbon and less energy-intensive supply chain begin with a smaller energy debt. The result is a finding from this model and these US scenarios, not a universal clock for every project.
NREL also estimated life-cycle greenhouse gas emissions of roughly 10 to 36 grams of carbon dioxide equivalent per kilowatt-hour, depending on the manufacturing and installation case. Those emissions are not zero, but they are counted across the system’s full life rather than released each time sunlight reaches the panel.
Solar’s output arrives on nature’s schedule
Solar generation has a simple constraint that manufacturing efficiency cannot remove: output follows daylight. On a clear day, many systems in the same region climb toward high production around midday and fall together as evening arrives.
Electricity systems must balance supply and demand continuously. If solar output exceeds what customers are using, what batteries can store and what transmission lines can move elsewhere, operators may curtail generation. That means instructing a plant or inverter to produce less than it could.
Curtailment is not evidence that solar produces no useful energy. It is evidence that the value of one more unit of electricity depends on when and where it appears.
The IEA’s 2025 renewable electricity analysis found curtailment becoming more common in several markets as solar and wind expand. The causes included transmission limits, system-stability requirements and mismatches between supply and demand. The agency’s conclusion was not that variable renewables had reached a fixed ceiling. It was that generation, grids and flexibility have to be planned together.
Batteries help, but they are not the whole grid
A battery can store electricity during a bright afternoon and return it during the evening peak. This is the most intuitive response to solar’s timing problem, and deployment has accelerated.
According to the IEA’s 2026 assessment of electricity-system flexibility, utility-scale battery project costs fell by about 40 percent in 2024 to roughly $150 per kilowatt-hour. New utility-scale installations reached 63 gigawatts that year, taking worldwide capacity to 124 gigawatts.
Capacity in gigawatts does not tell us how long those batteries can discharge. A battery designed to deliver one gigawatt for one hour and another capable of delivering it for four hours have the same power rating but very different energy capacity. This is why discussions of storage need both gigawatts and gigawatt-hours.
Storage is also only one form of flexibility. Transmission can move surplus power into a region where demand is higher. Demand-response programs can shift some industrial processes, water heating, cooling or vehicle charging toward periods of abundant generation. Hydropower and other dispatchable sources can change output. Grid-forming inverters and synchronous condensers can supply technical services that conventional rotating generators once provided by default.
No single option solves every timescale. Batteries are well suited to fast balancing and moving energy across hours. Transmission addresses geography. Demand flexibility changes the shape of consumption. Longer periods of low sunlight require resources that can bridge days or seasons.
Grids take longer to build than solar farms
The mismatch is not only electrical. It is temporal and institutional.
The IEA’s 2026 grid analysis estimated that planning, permitting and completing new grid infrastructure can take five to 15 years. Renewable projects such as solar and wind can take one to five years. The agency counted more than 2,500 gigawatts of renewable generation, storage and large electricity demand waiting in connection queues worldwide in 2025.
A queue is not the same as a fleet of projects certain to be built. Developers may enter more than one queue, projects can be speculative, and many will withdraw. Even with that caution, the backlog shows why adding panels and adding usable clean electricity are no longer identical tasks.
Solar supplied more than 8 percent of global electricity in 2025, but fossil fuels still provided more than half. Rapid growth from a smaller base does not erase the existing system in a year. It changes what the next stage of work looks like.
I find the shift revealing. The old argument asked whether solar could produce enough energy to justify the energy used to build it. Modern systems can repay that manufacturing energy in a small fraction of their operating life. The question now is whether grids, storage and electricity demand can change quickly enough to use what millions of panels produce together at noon.
