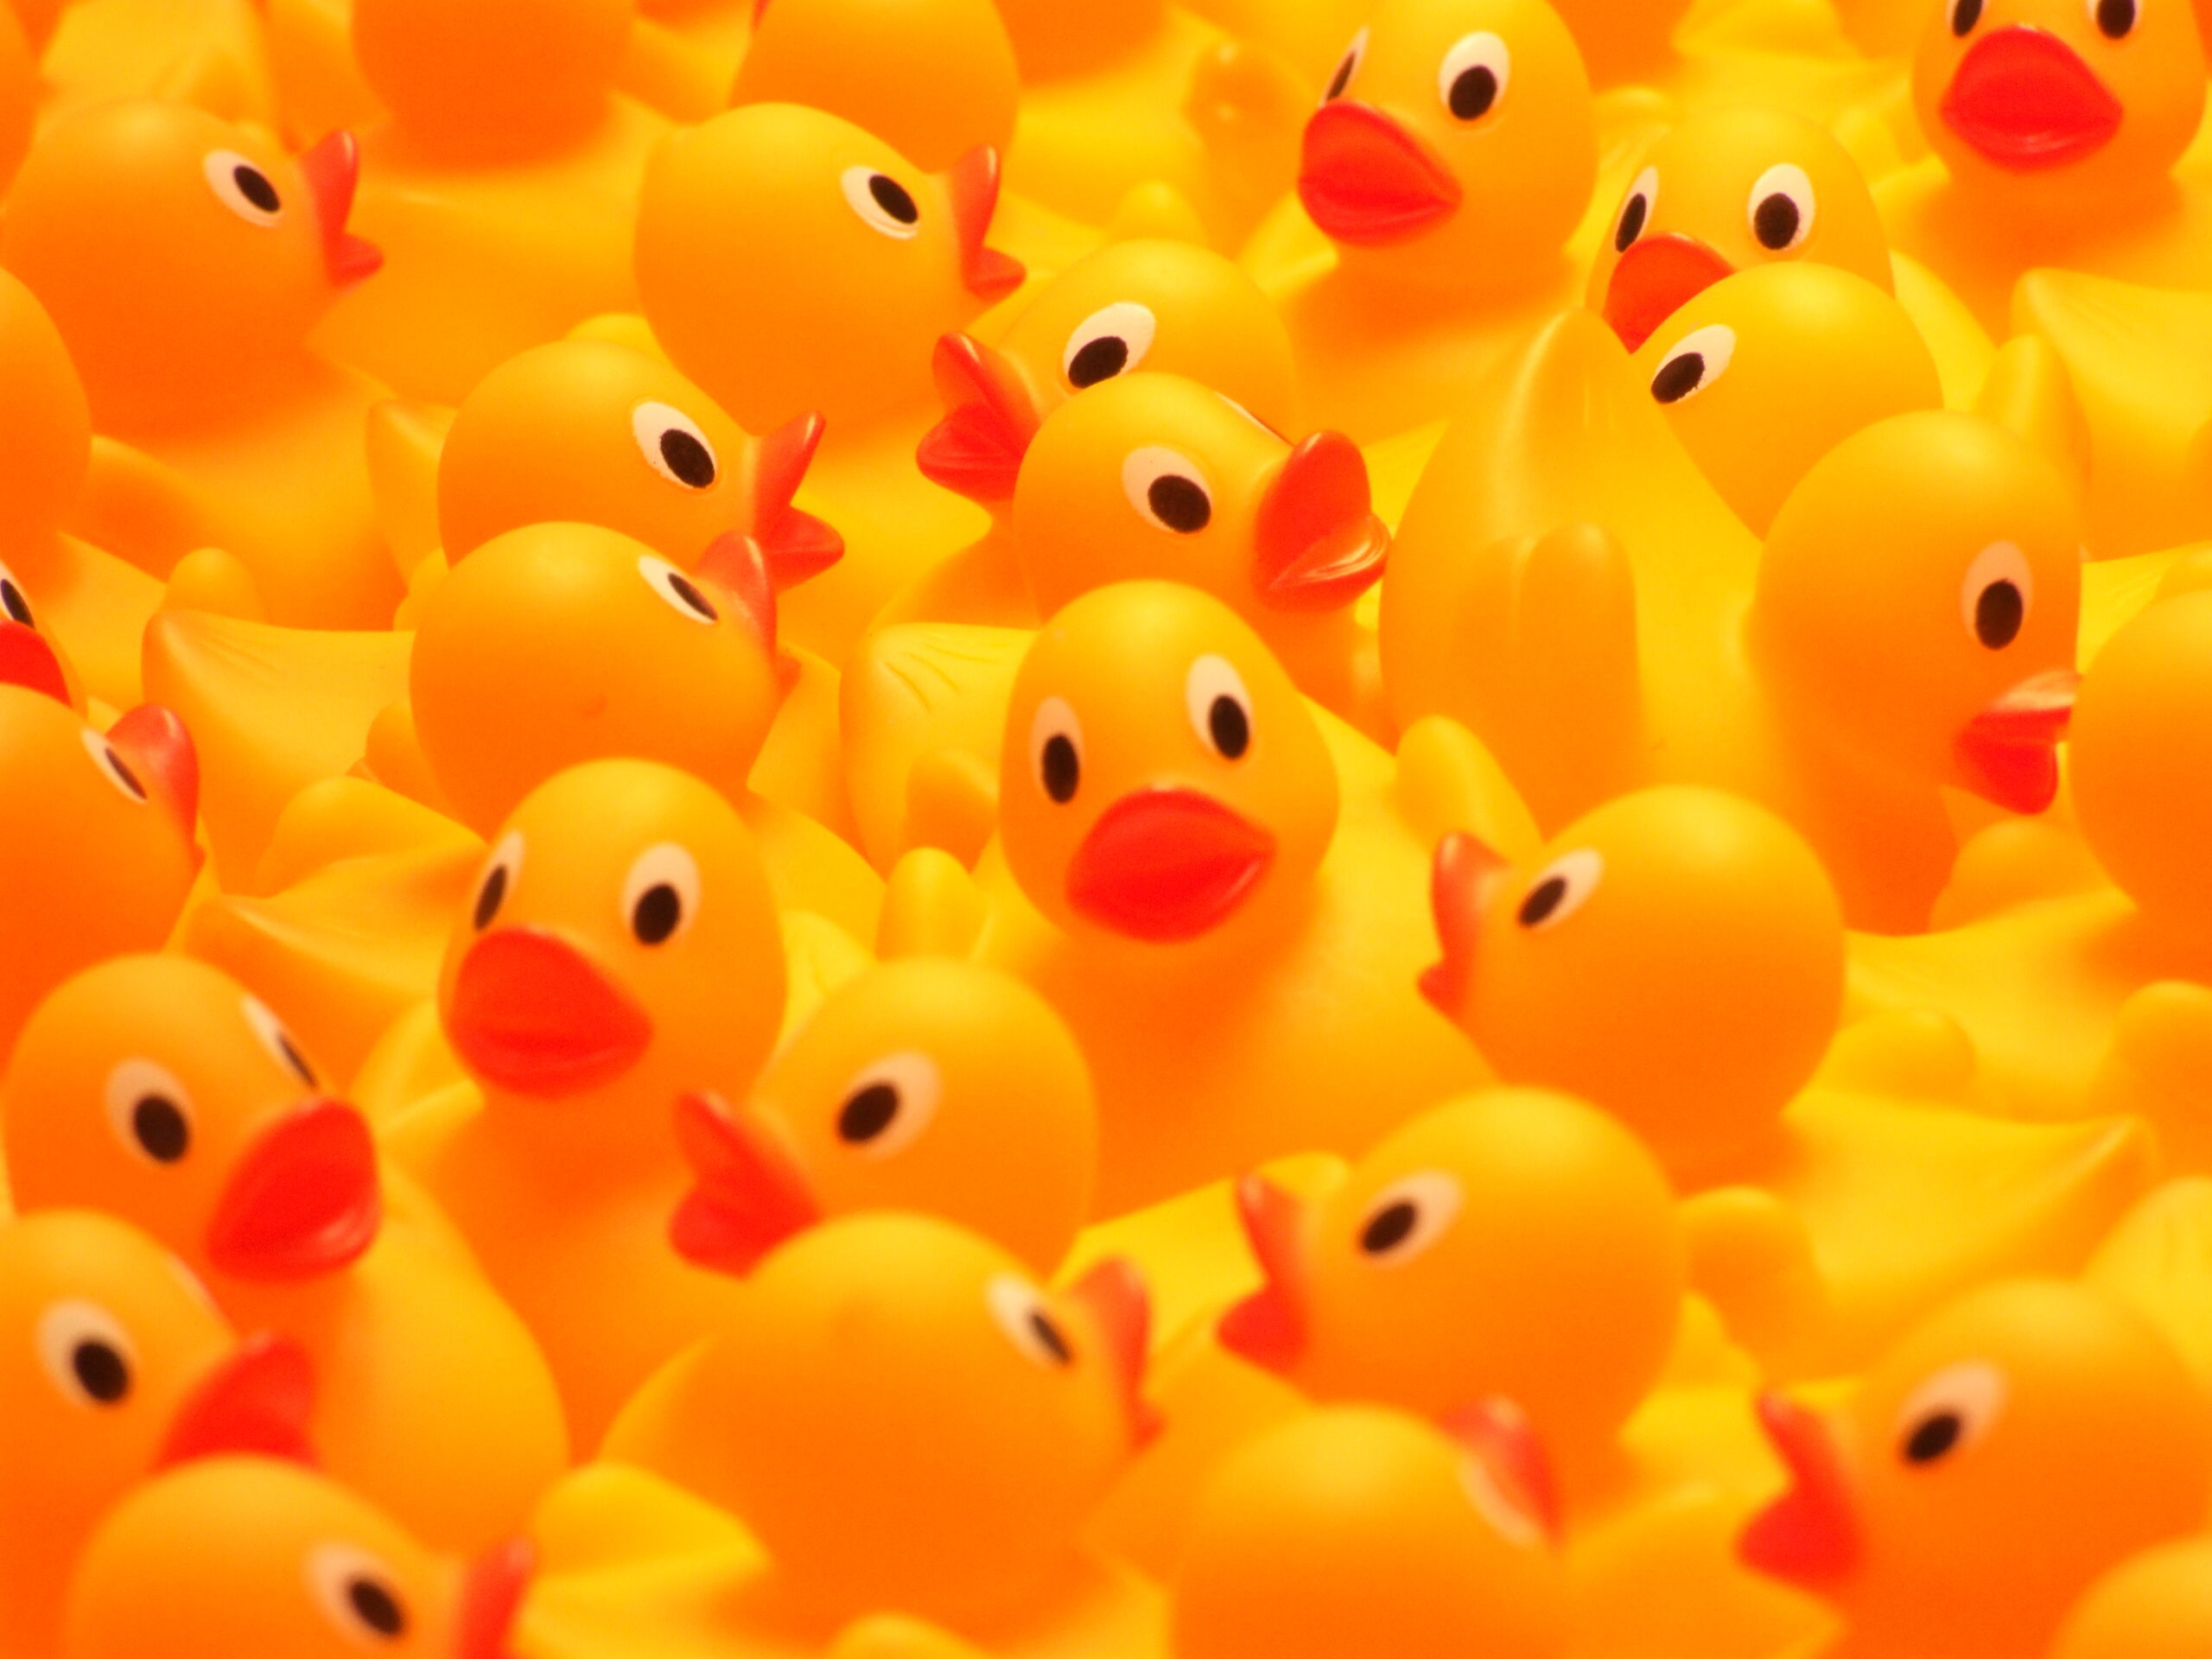
Twenty-eight thousand eight hundred plastic bath toys — yellow ducks, red beavers, blue turtles and green frogs, made in China and sold by The First Years as Friendly Floatees — went into the North Pacific on January 10, 1992, at 44.7°N, 178.1°E, a patch of open water within sight of nothing at all and a short swim from the International Date Line. They did not go in alone. Twelve containers, each 12.2 meters long, came off a container ship’s deck in severe storm conditions on the great circle route from Hong Kong to Tacoma, Washington; by later accounts the vessel was the Ever Laurel. One of those boxes held the toys. The cardboard packaging failed quickly in seawater, and the plastic animals — buoyant, hollow, sealed against leaks, and, crucially for what followed, identifiable at a glance — began to drift.
That last quality is why the spill matters to physical oceanography rather than only to salvage law. A floating object of known origin, known release date and known release position is an experiment that nobody had to fund. Curtis C. Ebbesmeyer, a Seattle oceanographer who had already built a practice out of tracking spilled cargo, and W. James Ingraham Jr. of NOAA’s Alaska Fisheries Science Center in Seattle, who maintained a surface-current model called OSCURS, recognized what twelve containers had just handed them and published the case in Eos on September 13, 1994, under the plain title “Pacific toy spill fuels ocean current pathways research.”
From the Date Line to Sitka
The toys made Alaska in the same year they were lost. Ebbesmeyer’s own account of the spill in Beachcombers’ Alert dates the arrival to August and September 1992, after roughly 2,200 miles adrift, with hundreds beaching near Sitka. It was a matter of months, not years, and something on the order of 3,200 kilometers of open water between the release coordinates and the first Alaskan shoreline.
Most of those 1992 finders left no lasting record. The systematic ledger starts the following year, and it belongs to two people. Dean Orbison and his son Tyler, working the shorelines near Sitka, began noting the date and location of every toy they picked up in 1993 and kept at it for more than a decade. At Sitka’s beachcomber fair in July 2004 they laid out 111 toys collected between 1993 and 2004; by 2005 their total stood at 124. The mix ran across all four molds in comparable numbers — 35 percent ducks, 26 percent beavers, 21 percent frogs, 18 percent turtles — which is closer to what a carton packed with one of each animal would scatter than to anything sorted. Ebbesmeyer notes that the first peak, in 1992, came before the Orbisons started recording, in a year when other beachcombers were reporting hundreds.
The reports fed straight into OSCURS. The Ocean Surface Current Simulator calculates currents by adding long-term geostrophic mean flows to those derived from sea-level atmospheric pressure grids across the North Pacific and Bering Sea, which means it can be run forward from any known release point. For the follow-up analysis, seventy simulated toys were released in the model at the exact time and date of the spill and tracked day by day for eleven and a half years, from January 10, 1992 to July 19, 2003. Low oceanic diffusion kept the simulated group together over the first leg, from the spill site to Sitka, and that coherence is precisely what allowed the model to be calibrated — against the toys’ windage and against the Sitka strandings themselves. Where the model and the plastic disagreed, the disagreement was the data point.
The gyre keeps the toys and returns them
What distinguished the Floatees from a one-way drift study is that the Pacific Subarctic Gyre does not dispose of what it collects. It circulates it. The counterclockwise loop that carried the toys east to Alaska continued them west along the Aleutians, south past Kamchatka and Japan, and back toward the release longitude. Ebbesmeyer, Ingraham, Thomas C. Royer and Chester E. Grosch put the average circuit at just under three years — 2.99 years, drawn from nineteen estimates across seven data sets — in a second Eos paper, “Tub toys orbit the Pacific subarctic gyre,” published on January 2, 2007.
The Orbison ledger is what made that number measurable. Peak toy recoveries at Sitka fell in 1992, 1994, 1998, 2001 and 2004 — intervals of two, four, three and three years — and because father and son put in comparable beachcombing effort every season, the peaks are not an artifact of how much time they happened to spend on the shore. A floater that missed Alaska on the first pass got another chance, and another. The returns thinned as the fleet did: twenty-five toys in 1994, four by 2004.
A fraction of the fleet took a different exit. According to OSCURS, currents pushed some of the toys north through the Bering Strait into the Arctic Ocean, where pack ice carried them over the pole and down into the North Atlantic. Ice keeps its own schedule; what enters on the Bering side emerges years later on the Atlantic one. Ebbesmeyer and his coauthors laid out that circulation argument in the 2007 Eos paper, whose OSCURS-derived map shows toys leaving the Subarctic Gyre in two directions — north into the Arctic, and south into the subtropical gyre, which is how a turtle reached Kure Island in 1996.
Scotland, worn thin
The Atlantic leg is the part that made the story famous and the part that deserves the most caution. Ebbesmeyer logged two transarctic candidates in the summer of 2003: Bethe Hagens observed a duck in Maine that July, and Sonali Naik observed a frog in Scotland that August. These are thin against the Alaskan record — single objects set beside hundreds, each weathered by a decade of sun, ice and surf, and each difficult to tie definitively to the 1992 container rather than to some other batch of identical molded animals. The Pacific landfalls arrived in numbers, on a schedule a model could be checked against, in a known assortment. The Atlantic ones arrived singly, worn, and as observations requiring judgment. They are consistent with the Arctic route OSCURS describes. They are not proof of it, and the distinction is worth preserving.
What the spill ultimately produced was less a single result than a method: years of logged beachcomber reports, each carrying a date and a shoreline, folded back into a current model that could be corrected against them. Ebbesmeyer kept the ledger running long after the story stopped being news — through the Beachcombers’ Alert tally in 2004, the Eos follow-up in 2007, and past it, by which point he was projecting that the toys could complete ten orbits of the gyre by 2022. By 2007 the reported recoveries amounted to about 3.3 percent of the shipment, roughly the same return the same two researchers had seen from a spill of Nike sneakers in 1990. The Floatees were a reminder that the ocean’s surface is a slow, lossy, looping machine, and that 28,800 identical objects dropped into it will spend years telling you how it runs — if somebody is willing to keep the ledger.