A score built from 13 blood proteins and three routine clinical measures predicted type 2 diabetes better than a common lab proxy for insulin resistance, and flagged risk of liver, kidney and heart disease that a standard blood sugar test missed, in data from about 20,000 UK Biobank participants, a study in Nature Metabolism reports.
The work, led by Atul Deshmukh at the Novo Nordisk Foundation Center for Basic Metabolic Research at the University of Copenhagen, was published on 16 November 2026. Jeppe Kjærgaard and Nigel Kurgan are joint first authors.
The problem with measuring insulin resistance
Insulin resistance, when muscle, liver and fat respond weakly to insulin, is a central driver of type 2 diabetes and heart and metabolic disease. The gold-standard test is the hyperinsulinaemic-euglycaemic clamp, in which insulin and glucose are infused for two hours or more to measure how fast the body clears sugar.
The clamp is too costly and invasive for routine care, so doctors and researchers lean on stand-ins. These include HOMA-IR, calculated from fasting glucose and insulin, and the ratio of triglycerides to HDL cholesterol. The paper says these surrogates “capture only limited aspects of insulin action”.
What the team did
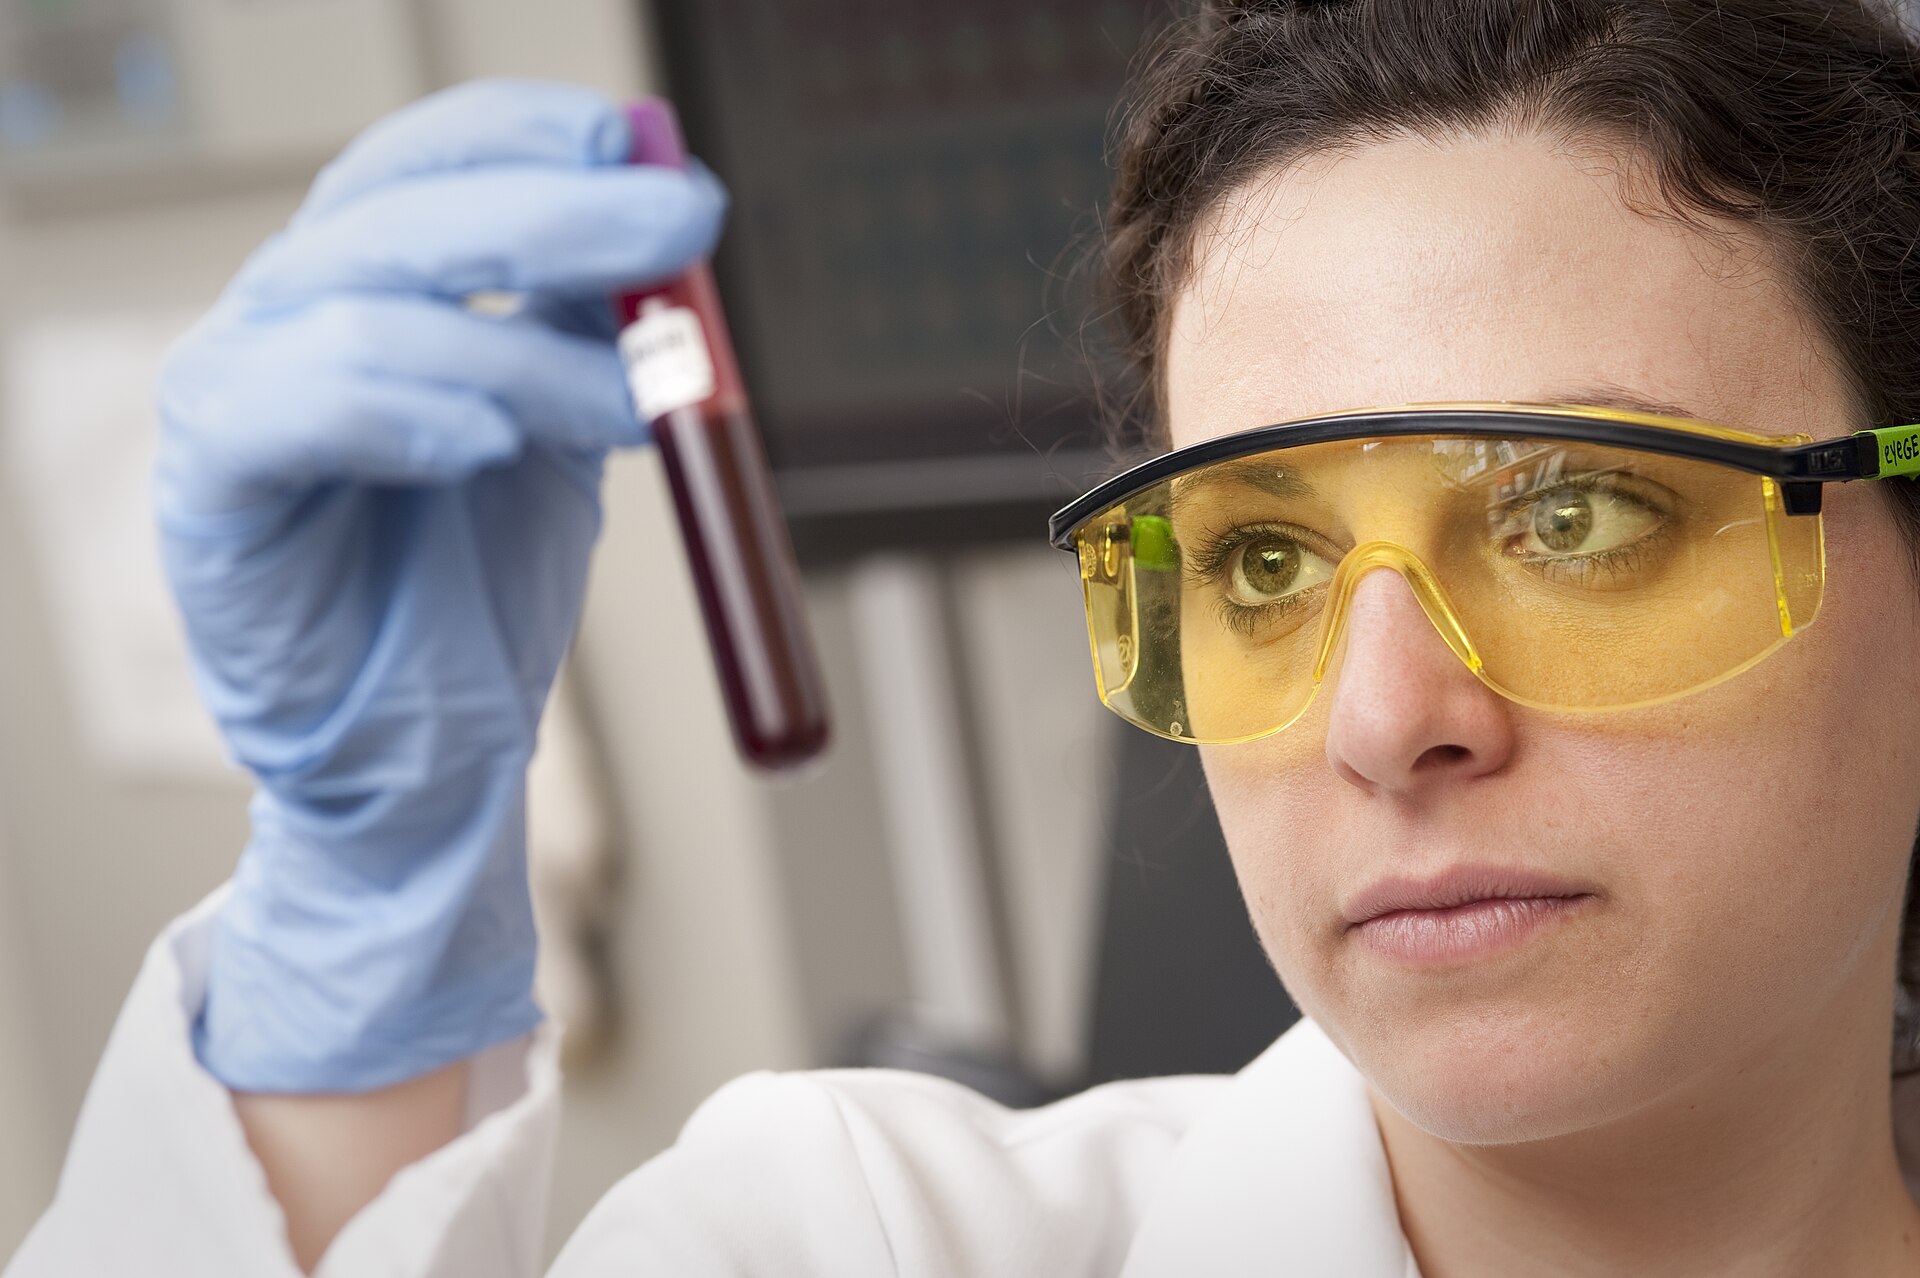
The researchers measured about 8,000 proteins in blood plasma from 161 people in three Danish and Swedish clinical cohorts, all of whom had their insulin sensitivity measured by clamp. They ranged from people with normal blood sugar to people with type 2 diabetes. To reach so many proteins, the team combined four mass spectrometry methods with Olink, an antibody-based protein panel.
They found 488 proteins linked to insulin sensitivity. After adjusting for age, body fat and sex, 62 proteins remained linked, and adiponectin, a hormone made by fat tissue and a known marker, showed the strongest association. By inferring which organ each protein comes from, the team traced the signal to the liver, fat tissue and immune cells, among others.
In 43 men who did eight weeks of high-intensity interval training, which raised their insulin sensitivity by 30 to 40 per cent, only 22 proteins changed significantly. The wider set of insulin-linked proteins shifted in a healthier direction, and liver-derived proteins were over-represented among those that fell.
From 161 people to 20,000
The team then used machine learning to predict clamp results from a short list of inputs. The best model used 13 proteins, including IGFBP1, leptin, GDF15, PON3 and the LDL receptor, plus sex, HbA1c (a measure of average blood sugar) and the triglyceride-to-HDL ratio.
In a separate group of 43 people, the model explained 73 per cent of the variation in measured insulin sensitivity. Across all 161 people in cross-validation the figure was 67 per cent, the number given in the abstract. Clinical measures alone explained 49 per cent.
Applied to about 20,000 UK Biobank participants with protein data, the predicted score was tested against 36 diseases over up to ten years. For type 2 diabetes it scored a concordance index of 0.86, against 0.74 for the triglyceride-to-HDL ratio. A score of 1 means perfect ranking of who falls ill first and 0.5 is chance.
HbA1c did slightly better for diabetes, at 0.88. Where the protein score pulled ahead was in other conditions. For fatty liver disease it scored 0.78, against 0.58 for HbA1c, and it also beat HbA1c for heart attack, stroke caused by blocked arteries, obesity, chronic kidney disease, heart failure, high blood pressure and sleep apnoea.
The authors say this pattern points to shared risk “driven by systemic metabolic dysfunction underlying insulin resistance rather than by glycaemic dysregulation alone”.
A second population check
The UK Biobank lacks the data needed for HOMA-IR and the Matsuda index, a measure taken from an oral glucose tolerance test, so the team also tested the score in Inter99, a Danish cohort of about 1,700 people followed for a median of 18.1 years. There, higher predicted insulin sensitivity was linked to lower risk of type 2 diabetes (hazard ratio 0.49), obesity (0.61), chronic kidney disease (0.5) and sleep apnoea (0.68).
For most outcomes the score matched or beat HOMA-IR and the triglyceride-to-HDL ratio. It was also linked to lower death from any cause (hazard ratio 0.56) and lower risk of stroke (0.66), associations the paper says were not seen consistently for the other indices.
It did not win everywhere. The Matsuda index was the strongest single predictor of type 2 diabetes in Inter99, with a hazard ratio of 0.21.
What the study cannot show
The disease predictions come from existing cohorts analysed after the fact, not from a trial in which doctors used the test to guide care. The study does not show that measuring these proteins would lead to earlier treatment or better outcomes.
The clamp cohorts were small and mostly of European ancestry, which the authors say may limit how widely the results apply. The model could only use proteins on the Olink panel, organ assignments came from gene-activity databases, not protein databases, and the effect of medicines on the protein profile was not examined. The exercise findings came from men only.
The authors call for broader protein coverage, more diverse populations and repeated sampling over time to refine it.
Spot an error in this article? Email [email protected]