

Between 1970 and 2017, North America lost a net 2.9 billion breeding birds, a reduction of roughly 29 percent of the birds alive at the start of that period. The estimate comes from a 2019 paper in Science led by Kenneth V. Rosenberg, then of the Cornell Lab of Ornithology and the American Bird Conservancy.
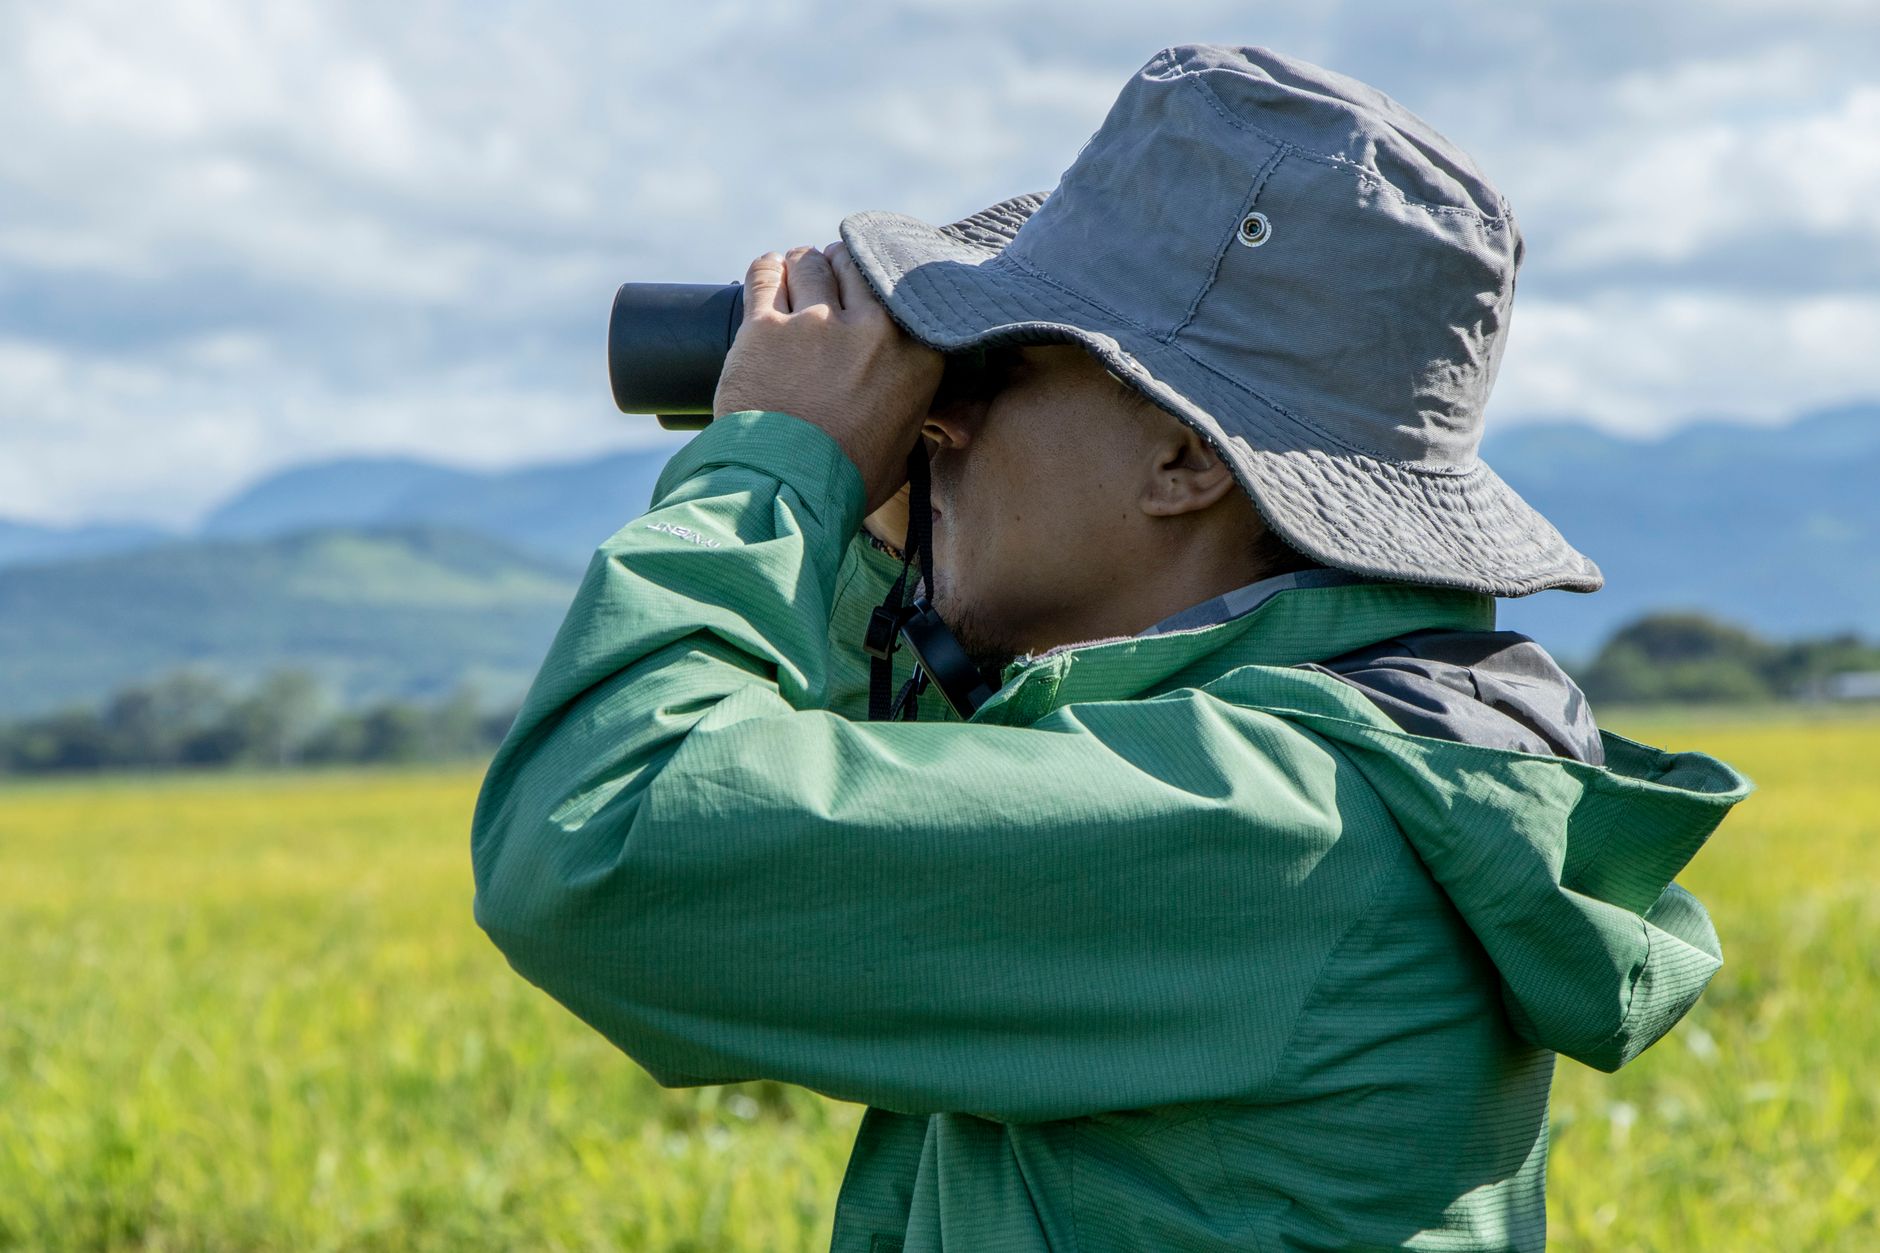
Most of the raw material behind that number was gathered by people with binoculars who were not paid to collect it.
The North American Breeding Bird Survey supplies the population trajectories for most of the landbirds in the analysis. It is coordinated by the United States Geological Survey with Canadian and Mexican partners, but the counting itself is done by around 2,500 volunteer observers. Each drives an assigned roadside route of about 24.5 miles, stops 50 times along it, and records every bird seen or heard within a quarter mile radius during a three minute count. Observers start half an hour before local sunrise and finish about five hours later. The survey has run every June since 1966, growing from just over 500 routes in its first year to roughly 3,000 sampled annually in recent decades.
The finding is worth taking seriously, but it should not be read as the final word. It rests on one modeling effort, published once, and its authors were explicit about the assumptions inside it.
What the study actually did
Rosenberg and his co-authors did not count 2.9 billion missing birds. They combined range-wide population size estimates with 48 year population trajectories for 529 species, which is about 76 percent of the breeding species on the continent, and calculated the net change in total abundance. Gains were subtracted from losses. Thirty-eight bird families showed a total decline of 3.2 billion individuals; 29 families showed gains of about 250 million. The difference between those two figures is the number that traveled around the world.
The second line of evidence came from machines rather than people. The team used 143 NEXRAD weather radar stations across the contiguous United States to measure the biomass of birds passing overhead at night each spring between 2007 and 2017. That analysis showed a decline of 13.6 percent, with an uncertainty of plus or minus 9.1 percent.
The width of that interval matters.
A decline somewhere between 4.5 and 22.7 percent over a decade is a real signal, but it is a loose one, and the radar declines were statistically significant only for the continental United States as a whole and for the Mississippi and Atlantic flyways. The Pacific and Central flyways showed no consistent trend. What makes the radar useful is not its precision. It is that radar and volunteer counts are completely independent methods, and they pointed the same direction.
The survey that produces the numbers
Volunteer bird counting in North America is older than the science that now depends on it. Audubon’s Christmas Bird Count began on Christmas Day 1900, when the ornithologist Frank M. Chapman proposed counting birds over the holidays instead of shooting them in the annual side hunt. Twenty-seven people held 25 counts that first day and tallied around 90 species. The count has run every winter since, and the Rosenberg paper drew on an analysis of its trends alongside the Breeding Bird Survey, waterfowl surveys and shorebird surveys.
The modern version of the same habit is eBird, launched by the Cornell Lab of Ornithology in 2002 as a place for birders to file their checklists. It passed one billion observations in 2021. In August 2025 the Cornell Lab announced that eBird had reached two billion sightings and three million sound recordings.
None of these were designed as a biodiversity monitoring system for the Anthropocene. They were designed as things birders already wanted to do, recorded in a format that could be added up later.
Where the 2.9 billion figure gets misread
The most common misreading is that 2.9 billion birds died in some unusual way, or that species are disappearing at that rate. Neither is what the paper says. This is a measurement of abundance, not extinction: it counts how many fewer individual breeding birds there are, across species that in most cases are still present. The authors’ argument was that the conservation conversation had been focused on rare species while common ones were quietly thinning out.
The second misreading involves which birds were lost. Ten introduced species, including the house sparrow and the European starling, accounted for a net loss of about 392 million birds, a 63 percent drop within that group. That is roughly one in eight of the total. Some critics of the paper, including the University of Maine macroecologist Brian McGill, writing on the blog Dynamic Ecology shortly after publication, noted that a headline number partly composed of declining non-native species is doing something different from what most readers assume.
The authors reached the opposite conclusion from the same fact. In their reading, losses among introduced species and habitat generalists meant that the birds vanishing from human-altered landscapes were not being replaced by the birds that usually thrive in them. Both interpretations sit on the same table in the paper. In our reading, that disagreement is one of the more useful things about the study, and it is not resolved.
The losses were also not spread evenly. Grassland birds lost more than 700 million individuals across 31 species, a 53 percent decline, with 74 percent of grassland species trending down. Forest biomes lost more than a billion birds between them. Wetland birds were the exception, showing a net gain of 13 percent, driven by a 56 percent increase in waterfowl. Rosenberg told Scientific American at the time of publication that the recovery followed decades of hunting license revenue and billions of dollars directed into wetland protection. That is a plausible reading, and also a reminder that the waterfowl surveys behind it are a different monitoring system with different coverage.
What the volunteers cannot see
Roadside routes are, by definition, next to roads. Several papers cited in the study’s own supplementary materials have examined whether land cover along Breeding Bird Survey routes represents the wider landscape, and whether roadside habitat changes at a different rate than the country as a whole. The survey’s designers know this. It is the reason the radar analysis was included.
The survey also counts breeding adults in June. It does not measure what happens to those birds during migration or on wintering grounds in Central and South America, which is where several of the steepest proportional declines point. Species wintering in South America fell 40 percent. The paper’s authors described their estimate as conservative for exactly this reason, since it captures the loss of breeders without the reproductive output those breeders would have produced.
And a volunteer network is only as continuous as its volunteers. A count series that has run since 1966 is valuable because it has run since 1966, which means the risk to it is not scientific but administrative.
What has happened since
The 2019 paper prompted a coordinated response, including the Road to Recovery initiative and a running assessment of which species are closest to trouble. The 2025 U.S. State of the Birds report, published on March 13, 2025, by the North American Bird Conservation Initiative, identified 112 tipping point species that have lost more than half their populations in the past 50 years, 42 of them classed as red alert, and 229 species it says need urgent conservation action.
One line in that report is worth separating from the rest. Duck populations, the bright spot of the 2019 analysis and of earlier State of the Birds editions, have trended downward in recent years. The recovery that was held up as proof that conservation spending works has not held its gains.
These reports are not a fully independent check on the 2019 paper. The Cornell Lab and the American Bird Conservancy contributed to both, and both draw on the same volunteer survey data. A genuinely independent test would need different observers, different methods, or both, which is part of what the radar work was for and part of what makes the continuing expansion of eBird useful beyond its own findings.
What would settle the open questions is narrower and slower than a headline number: species-level analyses that follow individual populations through the full annual cycle rather than the breeding season alone, and enough years of radar to tighten those confidence intervals. Both depend on people continuing to write down what they see.
The Breeding Bird Survey is now approaching its sixtieth June. Whatever the next continental estimate says, it will be built from three minute counts at the side of the road, made by people who got up before dawn to do it.