

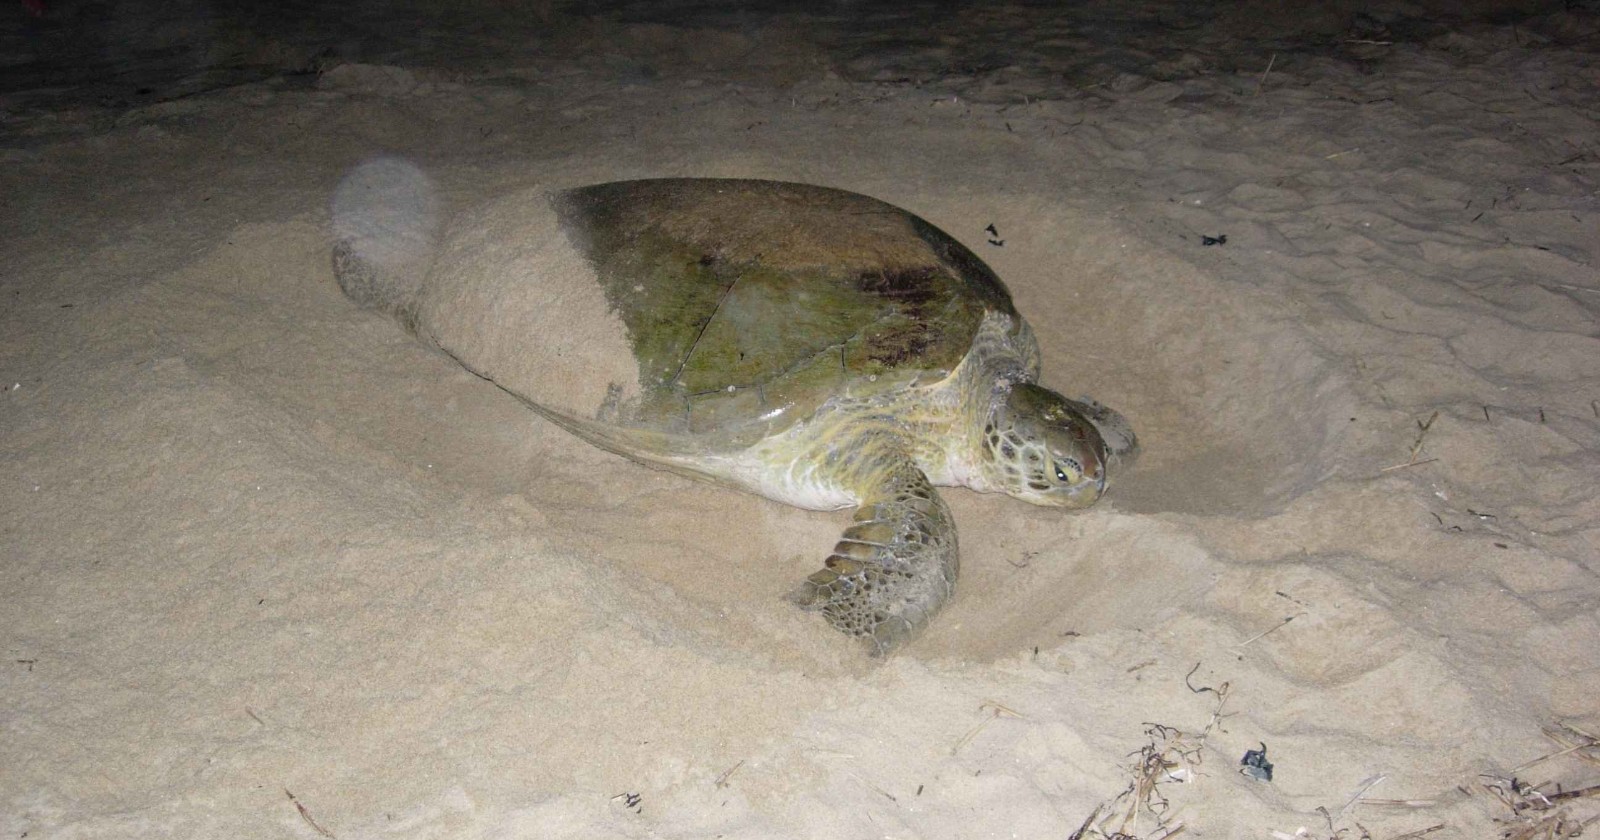
In 1993 the Sea Turtle Research Unit began walking a short stretch of sand on Redang Island every night of the nesting season. The beach at Chagar Hutang Turtle Sanctuary is about 350 metres long. The patrols counted nests, and they fitted Inconel tags to both front flippers of the green turtles they intercepted, replacing tags when needed.
Three decades later that record has produced something no shorter study could. Across the full run of monitoring, 4,609 individual green turtles were tagged, yielding 1,399 measurements of the interval between one breeding season and the next. Among the gaps that were three or four years long, the four-year share rose from 28 percent to 37 percent. The authors report it as the first systematic long-term change in sea turtle breeding periodicity on record.
The work, by Jared Tromp, Mohd Uzair Rusli, David Booth and Graeme Hays, appears in Royal Society Open Science as an open access paper.
From a few hundred nests a year to well over a thousand
The first half of the story is a conservation success. Annual nest numbers at Chagar Hutang ran at roughly 400 to 500 at the start of the time series and reached roughly 1,500 to 2,000 in recent years, a three to fourfold increase across three decades. An exponential trend fitted to the counts returns an R-squared of 0.52.
That local pattern sits inside a global one. Green turtles were listed as endangered by the IUCN in 2004, and in 2025 the assessment was changed to least concern, on the strength of nesting recoveries at many sites around the world.
The turtles themselves are long-lived enough to make the record personal. More than half of the tagged animals were seen more than once, and one individual was recorded up to 79 times across 28 years.
Why counting the years between nests is harder than it sounds
A female green turtle lays several clutches within one season and then disappears for years, because the fixed costs of migrating and breeding are too high to pay annually. The gap between clutches inside a season is the inter-nesting interval, and at Chagar Hutang it has a clear mode of 10 days with a second peak at 20 days. Re-sightings at zero to seven days are turtles that crawled up the beach and did not lay, termed a false crawl.
The gap between seasons is the remigration interval, and it is the number that carries the finding. Across all years the modal remigration interval was three years, accounting for 37 percent of all recorded intervals, with four years at 20 percent and five years at 15 percent.
The difficulty is that a turtle can nest on a beach nobody is watching. Redang has other beaches, and only Chagar Hutang has a dedicated tagging programme. A female who slips away for one season and nests unobserved will appear in the data as having taken twice as long as she did. That is why the authors treat the longer intervals, five years and above, as the ones most likely to be inflated.
An index built around the turtles nobody saw
The detection problem is what decides whether the headline holds. The team measured how efficiently the study beach was patrolled by asking what proportion of re-nesting turtles were re-sighted after a single inter-nesting interval of 8 to 15 days, rather than after some longer gap. That efficiency fell over the study, from 97.8 percent in 1993 to 74.0 percent in 2024, a decline of about 0.77 percent a year. It stayed above 70 percent for most of the period.
A detection rate that falls while an interval appears to rise is exactly the pattern a spurious result would produce. So the team did not report a mean remigration interval at all. They reported the ratio of four-year to three-year intervals, on the reasoning that missing a turtle for one season turns a two into a four or a three into a six, but does not turn a three into a four.
That ratio is an index rather than an average, and it is the reason the trend survives the detection problem. It is also a narrower instrument than a mean would be. It says the mix shifted; it does not say by how much any individual turtle slowed down. It also counts intervals rather than animals. The paper plots nine individual turtles, and they show a mixture: some held one rhythm across every recorded return, others moved around, and in two cases a three-year gap became a four-year one.
A second bias runs the other way, which strengthens the result. A turtle first tagged three years before the record closes cannot yet have shown a four-year gap, so the late years of the series systematically under-record exactly the long intervals the paper reports as rising.
The three to four switch
Measured that way, the four-year share of three- and four-year intervals rose significantly between the early and late halves of the record, with a chi-squared value of 25.33. The share climbed from 28 percent to 37 percent between the first half of the record and the second. Those two percentages appear only in the paper’s abstract, which dates the early window 1997 to 2012, while the results section and Figure 3 describe the same comparison as running from 1993.
The index also tracked the nest count directly. As annual nest numbers rose, the four-year share of three- and four-year intervals rose with them, though the relationship is a loose one: an R-squared of 0.23 leaves most of the year to year variation unexplained.
One further comparison was tested and came back flat. The rare one-year returns showed no significant difference between the two periods, at p equal to 0.17. Separately, and without a test attached, the paper reports that three- and four-year gaps together made up 64 percent of all remigration intervals up to six years in the first period and 66 percent in the second. What moved, then, was the balance within that pair rather than its size.
What a longer gap costs
A female that waits four years instead of three lays fewer clutches per year on average. The paper works this through with a deliberately simple illustration rather than a measurement. If the share of females on a three-year cycle fell from 80 percent to 50 percent, mean per capita egg output for those individuals would drop by about 8 percent. Those input percentages were chosen to demonstrate the arithmetic and are not taken from the Redang data, and the 8 percent figure should be read the same way.
The authors do say this matters. All else being equal, a longer gap lowers the mean annual reproductive output of individuals and so acts to reduce the rate of population increase, and they write that the finding might have important global conservation implications. What they add is that where there are marked increases in nesting numbers, as they report here, that increase may outweigh the reduced output per female.
The harder question is what caused the shift, and in the discussion the paper is careful. The most parsimonious explanation is that foraging conditions have got worse, so each turtle takes longer to reach the body condition that breeding requires. Beyond that the evidence runs out. Green turtles graze seagrass, and seagrass abundance has been negatively affected by climate change at some sites. Green turtles have also been observed overgrazing seagrass meadows where their own numbers are high. The paper’s abstract names density dependence alone as the candidate; its discussion sets crowding and climate side by side and says the specific reason is unknown. Separating them, on this reading, is a job for other beaches rather than this one.
One alternative was checked and set aside. If the population had simply aged, older females might breed less often. But captive studies find no evidence of reproductive senescence in green turtles, and the individual records here show no systematic change in turtles’ remigration intervals over time, so the authors judge senescence an unlikely explanation.
The whales showed it first
Southern right whales off southern Australia have been reported skipping breeding years at an increasing rate, with reproductive output falling over time and the cause similarly unresolved. That observation came first. What the turtle record adds is that it was not an isolated case among long-lived marine animals that pay a large fixed cost to breed.
The test the authors propose for separating crowding from climate is comparison across sites. The same three to four index can probably be computed wherever a beach has been tagged for long enough, and they suggest checking whether the lengthening tracks the rate of increase in nesting numbers from site to site.
Chagar Hutang holds one of the longest published records of breeding periodicity for this species, covering one beach, with the four-year share of its three- and four-year gaps up from 28 percent to 37 percent. The turtles are back on Redang in numbers the 1993 patrols never saw. How long the gaps between their nesting seasons run is the measurement that is now moving.