
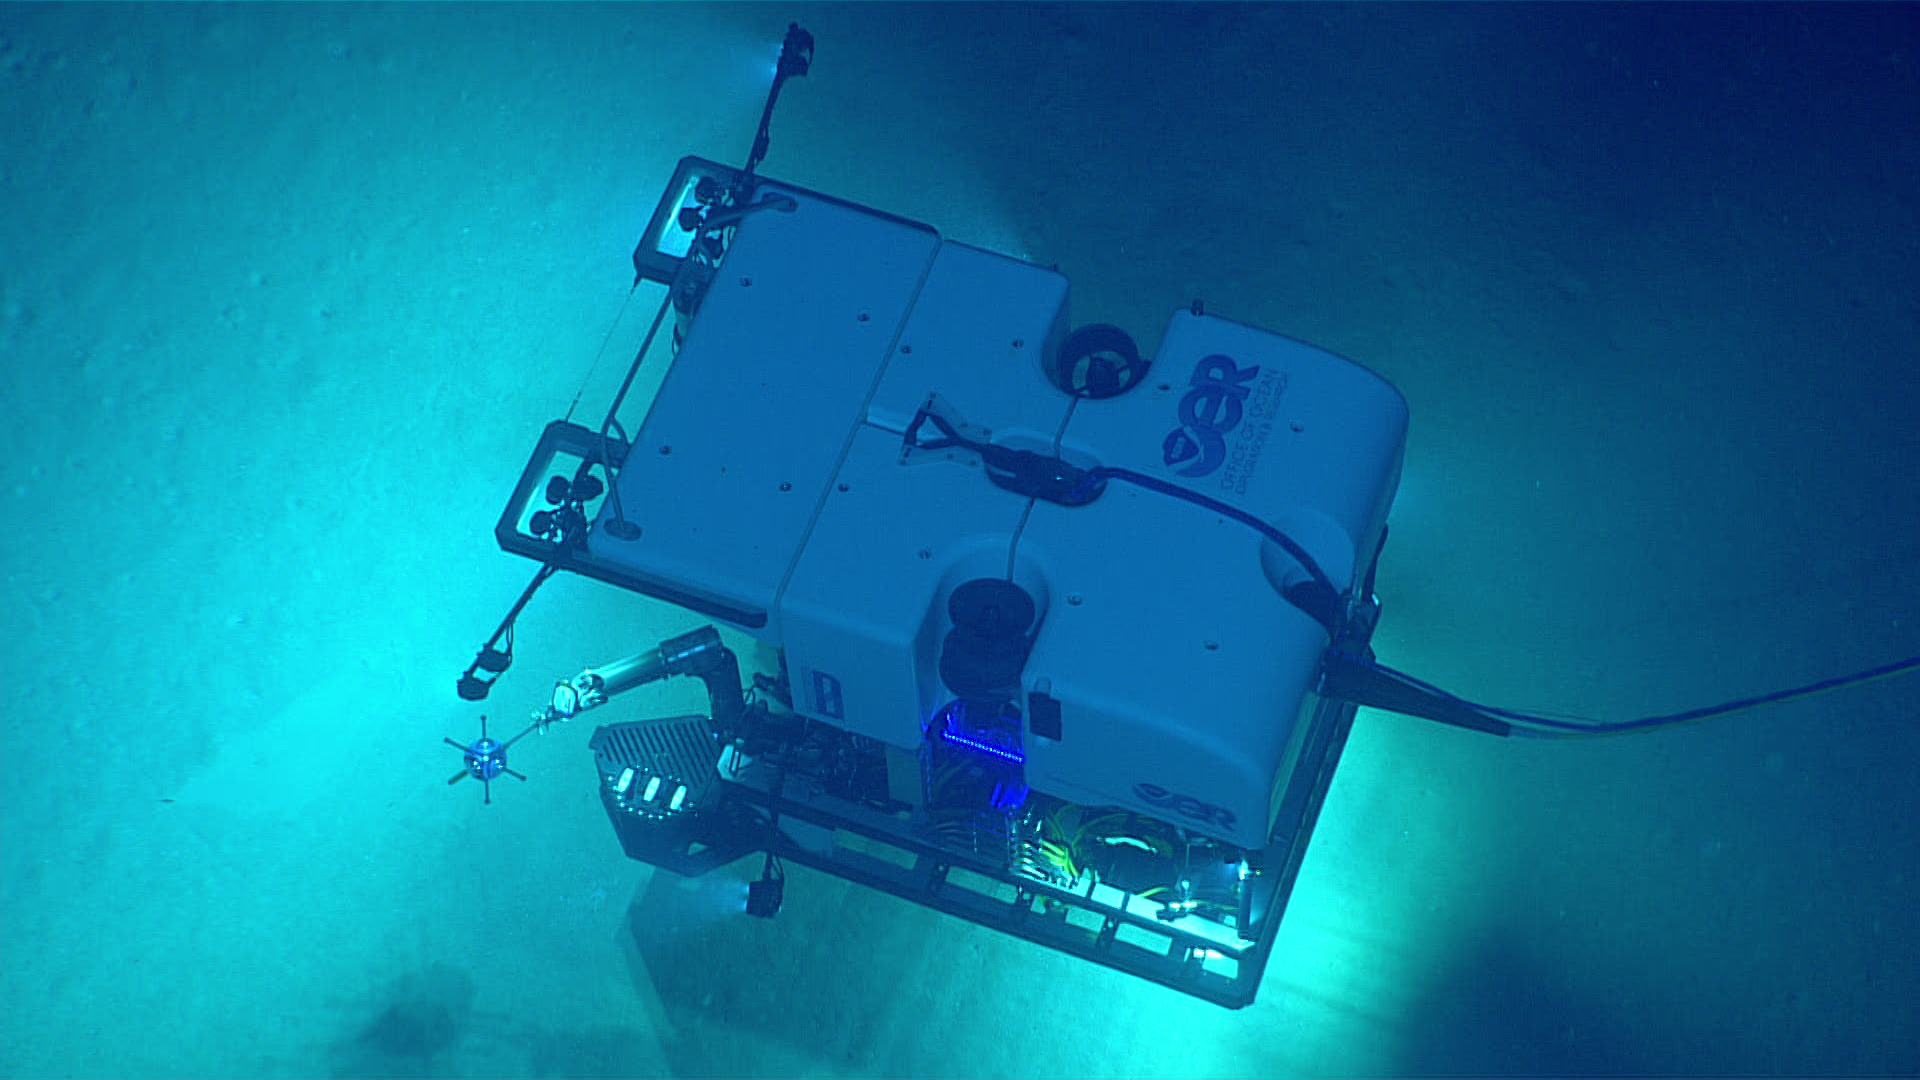
For nearly seventy years, cameras have descended through the dark aboard crewed submersibles, remotely operated vehicles, autonomous machines and towed platforms. Put every known strip of deep seafloor they recorded together, however, and the total would still cover less than 0.001 percent of the bottom below 200 metres.
That is not a poetic way of saying the ocean is mysterious. It is the result of a 2025 analysis in Science Advances that assembled 43,681 deep-submergence records from 1958 to 2024 and calculated how much ground their cameras could plausibly have seen. Its upper estimate, 3,823 square kilometres, is roughly the area of Rhode Island.
The study also contains a less familiar calculation.
Existing systems visually cover an average of about 2.9 square kilometres per year. Even a fleet of 1,000 working at that rate would need roughly 115,800 years to cross the entire deep seafloor once.
What the researchers meant by “seen”
The study defined the deep seafloor as bottom at least 200 metres beneath the surface. It covers about 335.7 million square kilometres, equal to 66 percent of Earth’s entire surface. “Visually observed” meant imaged by a vehicle with an optical camera, not inferred from satellite data or measured only with sonar.
That boundary matters. A sonar survey can trace the height of a seamount or the walls of a canyon. A camera can show which animals live there, how they behave, whether sediment is soft or crusted, and whether a coral garden, cable, trawl scar or discarded object occupies the bottom. Mapping, visual observation and physical sampling are complementary ways of knowing a place.
The researchers gathered records from 34 institutions in 14 countries. The archived dataset covers 120 exclusive economic zones and the high seas, and includes human-occupied vehicles, remotely operated vehicles, autonomous underwater vehicles, camera tows and benthic landers. It is the largest compilation of its kind, but it is not every dive ever made.
It also spans a profound change in imaging. Almost 30 percent of compiled observations occurred before 1980, when dives could return low-resolution black-and-white stills rather than the continuous high-definition video common now. A square kilometre in the total is therefore not a promise of uniform image quality, navigation accuracy or biological annotation.
Two methods produced one very small range
The team estimated coverage in two independent ways. Its dive-based method assigned a likely viewing area to each activity, depending on the kind of platform, then accounted for overlapping tracks. That calculation returned a maximum of 2,130 square kilometres, or about 0.0006 percent of the deep seafloor.
The time-based method began with how long vehicles spent at the bottom. It combined bottom time with an assumed travel speed and a ten-metre visual swath, then used a deliberately generous average of 20 active systems per year between 1958 and 2023. That produced the larger figure of 3,823 square kilometres, rounded to 0.001 percent.
Twenty was intentionally conservative for estimating total coverage: the database represented an average of 14.7 active platforms a year. Choosing the larger number increased the amount presumed seen. The ten-metre swath likewise converted a vehicle’s narrow path into area without pretending its lights exposed an expansive landscape on either side.
This is why “roughly the size of Rhode Island” is a scale comparison rather than a claim that every camera track joins into one state-shaped block. The observations are thin lines and isolated frames scattered around the globe. As ScienceBlog’s earlier account of the dataset explained, the total is also an upper estimate of visible area, not proof that scientists identified everything passing through every frame.
The 100,000-year arithmetic
To estimate a realistic annual rate, the authors examined long operating records for nine systems: the human-occupied vehicle Alvin; the remotely operated vehicles Jason, Jason 2, Hercules, Little Hercules and Deep Discoverer; and the camera systems Argo, Argo 2 and Medea. Their estimated annual coverage ranged from 0.59 to 6.05 square kilometres, averaging 2.9.
One thousand systems at that mean rate would see 2,900 square kilometres each year. The deep seafloor covers 335.7 million. Divide the latter by the former and the result is about 115,800 years, hence the paper’s rounded “more than 100,000 years.”
It is an extrapolation, not a physical law or a timetable. It holds today’s average camera width, bottom time, speed and operational model constant for an absurdly long interval. Machines may become cheaper, more autonomous and able to work in coordinated groups. What the arithmetic establishes is narrower: simply multiplying the existing style of ship-supported operations cannot deliver a complete visual sweep on a human timescale.
A complete sweep would be scientifically inefficient too. Repeatedly filming immense stretches of similar abyssal sediment would consume time that could be spent comparing rare landforms, biological boundaries or regions absent from the record. Long before the last line was crossed, climate, currents and human activity would also have changed parts recorded near the beginning.
Unseen does not mean unmapped
The 0.001 percent figure is often confused with seafloor mapping. NOAA separates the two clearly. Satellite measurements provide a coarse global bathymetric picture, while multibeam sonar from ships supplies far finer depth measurements. Cameras then provide the visual ground truth needed to recognize organisms, habitats and small-scale conditions.
As of April 2026, 28.7 percent of the global seabed had been mapped to modern standards, a statistic included in ScienceBlog’s broader guide to what remains unknown about the deep ocean. That progress does not conflict with the visual estimate. A terrain model can show the shape of a hill without showing the sponge attached to it.
Nor does “unseen” mean that nothing is known. Researchers infer geology from acoustics, recover cores and animals, measure water chemistry and revisit selected sites in detail. The visual percentage describes the footprint of direct optical records, not the sum of all ocean knowledge.
The sample is small and strongly biased
Missing area is only half the problem. Sixty-five percent of the visual observations in the dataset fell within 200 nautical miles of the United States, Japan or New Zealand. Those three countries plus France and Germany accounted for 97 percent of compiled dives. What humanity has seen is therefore not a random miniature of the whole.
The pattern has shifted over time. In the 1960s, 51.2 percent of activity occurred in waters now classed as high seas; by the 2010s that share had fallen to 14.9 percent. Although 74.9 percent of the ocean lies between 2,000 and 6,000 metres deep, the proportion of dives going below 2,000 metres fell from 58.4 percent in the 1960s to 25.9 percent in the 2010s.
There are gaps in the compilation. Oil, gas and telecommunications companies hold proprietary imagery; some records are classified or embargoed; and scientific logs can be incomplete or impossible to locate. The true footprint is probably larger. Yet the authors note that even a tenfold underestimate would still leave less than 0.01 percent with any visual record.
This distinction keeps the estimate honest. It is a calculation from the accessible global record, not a census of every camera ever lowered into salt water. Its force comes from the order of magnitude surviving plausible missing data, while its policy value comes from revealing exactly where public evidence is concentrated.
That is a sampling problem, not an invitation to give up.
The answer is better sampling, not a complete film
No serious survey needs to watch every square kilometre to say something useful about a population or landscape. The more practical question is which observations would make the tiny global sample more representative.
In April 2026, a follow-up Science Advances study proposed 10,000 target locations. The design spreads them using four globally available characteristics: depth, seafloor landform, sediment composition and the flux of particulate organic carbon. A qualifying observation can be a short video or several still images taken within five kilometres of a target, accompanied by basic location and environmental metadata.
Completing those points would nearly double the number of unique deep-seafloor locations in the historical record. It would not reveal every animal or settle every management question. It would create the first statistically representative visual baseline and direct effort toward ocean basins, depths and national waters that past expeditions have undersampled.
That strategy matters as cameras encounter new life. ScienceBlog recently covered an Ocean Census programme that documented 1,121 candidate marine species in a year, a reminder that discovery depends on where researchers are able to look. Smaller imaging systems, longer-endurance autonomous vehicles, open archives and locally led expeditions can change both the rate of observation and who chooses the questions.
The deep seafloor is too large to watch in full. It is not too large to sample intelligently.