Look closely at a lobster sometime and you will notice its eyes do something ours cannot. Instead of a single lens, each eye is a dense grid of tiny square tubes, every one reflecting light inward off its polished walls, all of them pointing at the same patch of darkness. It is a strange way to see. It is also, as it happens, an excellent way to catch X-rays, which refuse to bend through ordinary lenses and instead skim off surfaces at grazing angles like stones across a pond. A team in Japan has now borrowed that crustacean trick, shrunk it onto a slab of etched silicon, and pointed it at the Moon.
The thing they want it to do sounds almost embarrassingly basic for 2026: draw a complete chemical map of the lunar surface. We don’t have one. After Apollo, after a parade of orbiters from half a dozen nations, the Moon’s elemental geography is still a patchwork of well-surveyed scraps and enormous blanks.
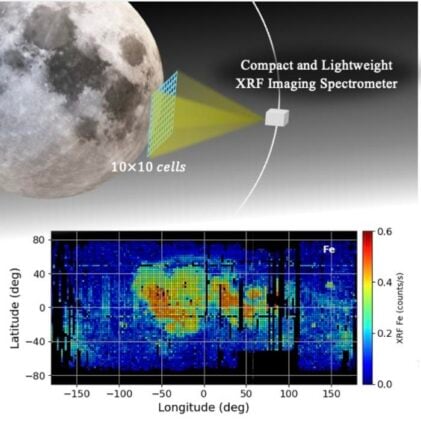
The reason comes down to how this kind of mapping works. Fire enough solar X-rays at lunar rock and the atoms in it fluoresce, each element coughing back X-rays at its own signature energy. Catch those and you can read off what the ground is made of, oxygen and iron and silicon and the rest, no shovel required. The catch is that you are entirely at the mercy of the Sun. No flare, no signal. And the Moon’s poles, the very places everyone now wants to land, sit at such a glancing angle to the Sun that the X-rays arrive feeble and slanting, barely enough to register.
So the polar regions, scientifically the most interesting real estate in the inner solar system right now, are precisely where the old technique goes blind.
Why Nobody Had Done This Already
Earlier missions did try. Apollo 15 and 16 mapped roughly a tenth of the surface. India’s Chandrayaan-2 managed a respectable 12.5-kilometre resolution but left gaps wherever the Sun stayed quiet, and China’s Chang’E-2 swept across about 65 per cent of the Moon yet couldn’t cleanly separate the signals of magnesium, aluminium and silicon, which sit awkwardly close together in energy. The instruments kept running into the same two walls: solar flares that didn’t oblige, and detectors that slowly cooked in space radiation until their readings smeared.
There was a third problem, more mundane and in some ways more stubborn. To stare at a wide swathe of ground during one of those rare, generous flares, you really want a telescope. But the X-ray spectrometers flown so far couldn’t carry one, because the only way they had to focus was a mechanical collimator, essentially a heavy honeycomb baffle, and bolting a proper telescope on top would have made the payload hopelessly bulky.
This is where the lobster eye earns its keep. The optics that Airi Toida, Yuichiro Ezoe and their colleagues at Tokyo Metropolitan University have adapted were not designed for the Moon at all. They were built for a small satellite mission called GEO-X, meant to photograph the faint X-ray glow of Earth’s own magnetosphere. The whole imaging unit, optics and sensor and filter together, is about the size of three stacked drink cartons and weighs under ten kilograms. You could, in principle, tuck it onto a spacecraft already going somewhere else.
What Two Years of Patience Buys You
The new work doesn’t fly the thing. Instead the team built a detailed numerical model, feeding in the telescope’s real measured quirks, its efficiency, its field of view, the way its sensitivity tails off toward the edges, and then simulated what a satellite in a polar orbit around the Moon would actually see over a realistic mission. They assumed a fairly ordinary Sun, around 300 flares of various sizes a year, which is about what our star tends to manage. Then they asked the obvious question: how long until you’ve gathered enough light to trust the map? The radiation worry, at least, looks manageable. In testing under conditions harsher than lunar orbit, the sensor’s energy resolution drifted by less than 50 electronvolts even after a punishing dose, which for this sort of work is reassuringly little.
The answer, for a single telescope: about two years to map five elements, oxygen, iron, magnesium, aluminium and silicon, across the entire surface at a resolution of 70 kilometres to a side. Iron and oxygen come fast, inside a few hundred days; the others take patience. Not a fine-grained map, but a complete one, which is the part nobody has managed.
And because each unit is so light, you needn’t stop at one. Pack 25 of them into a five-by-five array and the field of view balloons, letting the spacecraft drop to a lower orbit and tighten the grid to 30 kilometres while finishing in roughly a year. That version even teases out sodium, a notoriously shy element, within two years.
There are honest limits, and the paper doesn’t hide them. The heavier elements, calcium and titanium and the like, would need more than a century to map globally this way; you’d only ever catch them locally, during the strongest flares. And those 25 detectors are hungry. The cameras alone would draw at least 25 watts, which on a small spacecraft is not nothing, and that is before you’ve powered anything else. Whether the sums close is a question for mission planners, not models.
Still, the appeal is hard to miss with NASA’s Artemis programme circling back to the Moon and its Gateway station meant to hang in lunar orbit. A complete chemical atlas would do more than satisfy curiosity about how the Moon cooled and differentiated billions of years ago. It would tell future crews what the ground beneath a candidate landing site is actually made of before anyone commits to going. The poles especially, where the water and the ambitions both seem to be.
For now it lives in a computer, an instrument that hasn’t flown answering a question no one has yet funded it to ask. But the hard part, the optics, already exists and has the radiation scars to prove it. Sometimes the breakthrough isn’t a new idea so much as noticing that the right tool was sitting in the next room, built for something else entirely.
Source: Toida et al., Earth, Planets and Space (2026)
Frequently Asked Questions
Why can’t we just photograph the Moon to figure out what it’s made of?
Ordinary cameras see reflected sunlight, which tells you about colour and texture but not reliably about chemistry, especially for lighter elements like magnesium and aluminium. X-ray fluorescence works differently: solar X-rays make the atoms in the surface emit their own X-rays at energies unique to each element, so you’re reading a direct chemical fingerprint rather than guessing from appearance. The trouble is you need the Sun to cooperate with a flare first.
What does a lobster’s eye have to do with any of this?
X-rays won’t focus through a normal curved lens; they pass straight through or get absorbed. Lobster-eye optics get around this with a grid of tiny square channels that reflect X-rays off their inner walls at shallow angles, bending them toward a focus the way the real animal’s eye gathers dim light underwater. Mimicking that structure in etched silicon is what makes the telescope light enough to fly on a small satellite.
If the map is so useful, why hasn’t anyone made one yet?
Every previous attempt hit the same obstacles: solar flares are unpredictable, so coverage came in patches, and space radiation gradually degraded the detectors. On top of that, older X-ray instruments were too heavy to carry a real telescope, which limited how much ground they could survey during the brief windows when the Sun did flare. Getting past all three at once is what’s new here.
Could this actually help astronauts on future Moon missions?
That’s a large part of the motivation, given Artemis and the planned Gateway station in lunar orbit. A full chemical map would let mission planners know what the surface is made of at candidate landing sites before committing, particularly around the poles where future crews are headed. It’s the difference between scouting the whole neighbourhood and knowing only a few scattered streets.
ScienceBlog.com has no paywalls, no sponsored content, and no agenda beyond getting the science right. Every story here is written to inform, not to impress an advertiser or push a point of view.
Good science journalism takes time — reading the papers, checking the claims, finding researchers who can put findings in context. We do that work because we think it matters.
If you find this site useful, consider supporting it with a donation. Even a few dollars a month helps keep the coverage independent and free for everyone.