Skip to content
ScienceBlog.com
  • Featured Blogs
    • EU Horizon Blog
    • ESA Tracker
    • Experimental Frontiers
    • Josh Mitteldorf’s Aging Matters
    • Dr. Lu Zhang’s Gondwanaland
    • NeuroEdge
    • NIAAA
    • SciChi
    • The Poetry of Science
    • Wild Science
  • Topics
    • Brain & Behavior
    • Earth, Energy & Environment
    • Health
    • Life & Non-humans
    • Physics & Mathematics
    • Social Sciences
    • Space
    • Technology
  • Our Substack
  • Follow Us!
    • Bluesky
    • Threads
    • FaceBook
    • Google News
    • Twitter/X
  • Contribute/Contact

computational physics

An early-career physicist mathematically connects timelike and spacelike form factors, opening the door to further insights into the inner workings of the strong force. A new lattice QCD calculation connects two seemingly disparate reactions involving the pion, the lightest particle governed by the strong interaction. One reaction is known as the spacelike process, where an electron is bounced off a pion. The second reaction, known as the timelike process, is when an electron and antielectron collide, annihilate each other, and produce two pions. The lattice QCD numerical calculation is simultaneously able to describe the spacelike and timelike processes, demonstrating the interconnectedness of different reactions described by QCD. While this connection had been observed experimentally, now physicists have the math to corroborate it.

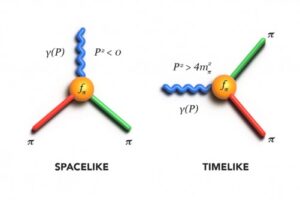
Physicists Crack the Code Between Matter and Antimatter Collisions in Groundbreaking Calculation

The computer vision simulation the researchers developed, compared with a photo from the explosion of Mt. St. Helens.

Breakthrough in Digital Fluid Simulation Recreates Mount St. Helens Eruption

An illustration of a quantum system that was simulated by both classical and quantum computers. The highlighted sections show how the influence of the system’s components is confined to nearby neighbors.

The surprising reason a classical computer beat a quantum computer at its own game

Contour plots (A, C, E, G) compare the input conditions, traditional finite difference method solutions, and the solutions generated by model B3, the most advanced model in the study. Velocity profiles (B, D, F, H) display detailed velocity information at specific cross-sections of the simulation domain.

Deep Learning Accelerates Fluid Dynamics Simulations, Solving Complex Equations 1,000 Times Faster

Substack subscription form sign up

Comments

  • Josh Mitteldorf on Red States and Blue States Are Becoming the Same Unhappy Country
  • Josh Mitteldorf on Scientists Have Written the Rules for First Contact, and Step One Is Don’t Panic
  • John E on A New Theory Says DMT Entities Might Be Real, and Proposes How to Test It
  • ScienceBlog.com on A New Theory Says DMT Entities Might Be Real, and Proposes How to Test It
  • John E on A New Theory Says DMT Entities Might Be Real, and Proposes How to Test It
© 2026 ScienceBlog.com | Follow our RSS / XML feed