Skip to content
ScienceBlog.com
  • Featured Blogs
    • EU Horizon Blog
    • ESA Tracker
    • Experimental Frontiers
    • Josh Mitteldorf’s Aging Matters
    • Dr. Lu Zhang’s Gondwanaland
    • NeuroEdge
    • NIAAA
    • SciChi
    • The Poetry of Science
    • Wild Science
  • Topics
    • Brain & Behavior
    • Earth, Energy & Environment
    • Health
    • Life & Non-humans
    • Physics & Mathematics
    • Social Sciences
    • Space
    • Technology
  • Our Substack
  • Follow Us!
    • Bluesky
    • Threads
    • FaceBook
    • Google News
    • Twitter/X
  • Contribute/Contact

weather

windmills

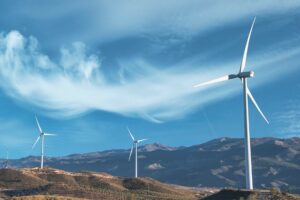
Power grids supplied largely by renewable sources experience lower intensity blackouts

Daily global average temperature values from MERRA-2 for the years 1980-2022 are shown in white, values for the year 2023 are shown in pink, and values from 2024 through June are shown in red. Daily global temperature values from July 1-July 23, 2024, from GEOS-FP are shown in purple.

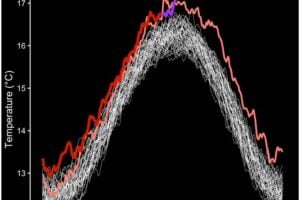
NASA data shows July 22 was Earth’s hottest day on record

Martian dustdevil

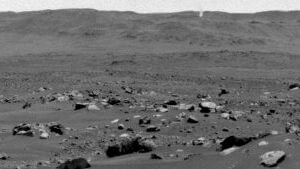
NASA’s Perseverance Captures Dust-Filled Martian Whirlwind

Substack subscription form sign up

Comments

  • Marco Messina on More Than a Third of Americans Have Lost Relationships Over Politics
  • Anon on Why Fructose Behaves Less Like a Calorie and More Like a Hormone
  • Mark Mellinger on Living Plastic Can Self-Destruct on Command
  • Marie Feret on The Silent Frequency That Makes Old Buildings Feel Haunted
  • Dax on The Silent Frequency That Makes Old Buildings Feel Haunted
© 2026 ScienceBlog.com | Follow our RSS / XML feed