For years, a vast telescope in the Texas hill country has been collecting light from the young universe and quietly throwing most of it away. Not out of carelessness: the Hobby-Eberly Telescope was built to find galaxies, and found them by the hundreds of thousands, charting their positions across a patch of sky covering more than 2,000 full Moons. But 95 per cent of the data it gathered (hundreds of millions of spectra from the seemingly empty stretches between those bright beacons) had nowhere to go.
Maja Lujan Niemeyer decided to look there instead. A recent graduate of the Max Planck Institute for Astrophysics, Lujan Niemeyer led the development of a new kind of map: the largest, most precise 3D chart yet of Lyman-alpha light in the universe as it existed between 9 and 11 billion years ago. The result, published this week in The Astrophysical Journal, doesn’t just fill in the gaps. It suggests the gaps were never empty to begin with.
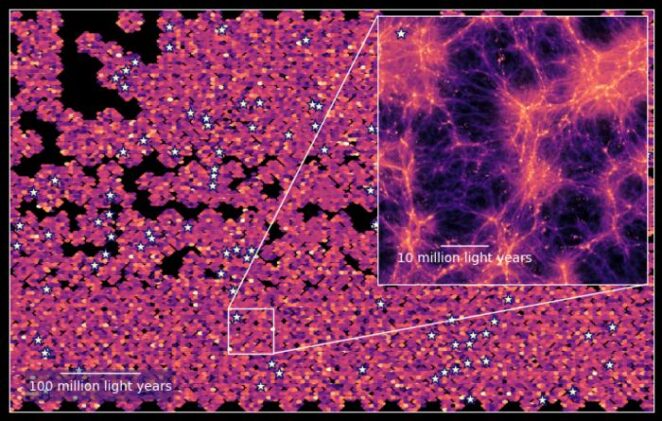
Lyman-alpha is the light produced when hydrogen atoms are excited by the energy of nearby stars. During the era the new map covers, roughly half the universe’s current age, stars were forming faster than at almost any point in cosmic history, and hydrogen was glowing brilliantly as a result. Astronomers have long used this glow to locate large, luminous galaxies: find the brightest sources of Lyman-alpha and you’ve found where the action is. The problem is that those bright galaxies account for only a fraction of what was actually there. Fainter galaxies, diffuse gas clouds, and the filamentary web of hydrogen threading through intergalactic space all emit the same light at levels too dim to detect individually. “Observing the early universe gives us an idea of how galaxies evolved into their current form, and what role intergalactic gas played in this process,” Lujan Niemeyer said. “But because they are far away, many objects in this time are faint and difficult to observe.”
The technique she used is called Line Intensity Mapping. Rather than cataloguing individual sources, it treats the sky as a statistical object, measuring the combined brightness of an emission line across an entire region and charting how that brightness varies from place to place. Julian Muñoz, an assistant professor at the University of Texas at Austin and co-author on the paper, puts it this way: traditional galaxy surveys are like mapping a continent from a plane and only marking the major cities. You’d get a clear picture of where the big population centres are, but everyone in the suburbs and small towns would be invisible. Line Intensity Mapping, he says, is like looking through a smudged window: you lose the sharp outlines of individual cities, but the total light from all of them reaches you.
That blurrier picture carries information the sharp one misses. “HETDEX observes everything in a patch of sky, but only a tiny amount of that data is related to the galaxies that are bright enough for the project to use,” said Lujan Niemeyer. “But those galaxies are only the tip of the iceberg. There’s a whole sea of light in the seemingly empty patches in between.”
To retrieve that sea, the team turned the project’s own galaxy catalogue into a navigation tool. Gravity, being what it is, causes matter to clump: wherever a bright galaxy sits, fainter neighbours are almost certainly nearby. Eiichiro Komatsu, scientific director at the Max Planck Institute for Astrophysics and co-author on the paper, explained that the team could use the positions of already-identified galaxies as signposts for estimating the distances of the fainter objects glowing around them. The result is a cross-power spectrum: a statistical measurement of how the Lyman-alpha intensity in those faint regions tracks the distribution of the bright galaxies, threaded across three epochs of cosmic time.
The raw material was staggering. HETDEX has been collecting data since 2017, accumulating over 600 million spectra. Processing roughly half a petabyte of it required custom code and supercomputers at the Texas Advanced Computing Center, along with careful, obsessive cleaning of the data to strip out contamination from sky emission, detector artifacts, and the light of the Milky Way itself. Karl Gebhardt, HETDEX’s principal investigator and chair of UT Austin’s astronomy department, noted that the project had always known it was gathering far more than it needed. “We only use a small fraction of all the data we collect, around 5%,” he said. “There’s huge potential in using that remaining data for additional research.”
What came out the other side was something neither a photograph nor a galaxy map in the conventional sense. The new chart shows how Lyman-alpha intensity rises and falls across a volume of space stretching billions of light-years. Crucially, the measurements are consistent with cosmological simulations that model how hydrogen light propagates through the universe, including the complex scattering effects that can redirect photons across vast distances before they reach us. They are, however, substantially lower than previous estimates based on correlating quasar positions with Lyman-alpha intensity, suggesting those earlier measurements may have been skewed by the turbulent environments surrounding quasars themselves.
That comparison matters beyond the specific numbers. “We have computer simulations of this period,” Komatsu noted. “But those are just simulations, not the real universe. Now we have a foundation which can let us know if some of the astrophysics underpinning those simulations is correct.” Getting that right has consequences for understanding how galaxies built themselves up over billions of years, and what happened to the gas that didn’t end up in stars.
The next step is to build maps that overlap. A Line Intensity Map charting carbon monoxide across the same cosmic volume would reveal where cold, dense molecular clouds were forming stars, letting astronomers read Lyman-alpha emission against the raw material fuelling it. Other instruments now coming online will extend the technique to different wavelengths and earlier epochs. “This study is a first detection, which is exciting on its own, and it opens the door to a new era of intensity-mapping the universe,” Muñoz said. A generation of telescopes spent decades learning to find the brightest things in the sky. What they were missing, it turns out, was the light between them.
Study link: https://iopscience.iop.org/article/10.3847/1538-4357/ae3a98
ScienceBlog.com has no paywalls, no sponsored content, and no agenda beyond getting the science right. Every story here is written to inform, not to impress an advertiser or push a point of view.
Good science journalism takes time — reading the papers, checking the claims, finding researchers who can put findings in context. We do that work because we think it matters.
If you find this site useful, consider supporting it with a donation. Even a few dollars a month helps keep the coverage independent and free for everyone.