In 1998 former tech consultant Hank Eskin launched a campaign to track dollar bills. Through the “Where’s George?” initiative, dollars were stamped with messages about the currency tracking project, and people were instructed to enter their zip codes and the serial number found on the stamped bills into a database, before handing over the currency.
The tracking of these dollar bills was an early study of human travel patterns and “complex systems.”
A complex system is an often-nebulous concept; entire seminars are devoted to defining the term. But, put simply, a complex system is anything composed of many parts that interact in such a fashion that the overall behavior of the system is entirely dependent on the interaction and is something different from a sum of the parts. Complex systems include financial markets, street networks, and even the human brain, made up of a system of neurons that work together to allow a person to think, make decisions, and perform day to day tasks.
“When you think of things like the human brain or the stock market, the market, for instance, exists only because of the interaction of buying and trading,” says Gourab Ghoshal, an assistant professor of physics at the University of Rochester, who studies complex systems. “If you have one trader, there is no market. If you only have one neuron, there is no brain.”
Today, the increasing availability of digital traces provides researchers like Ghoshal and the members of his lab an incredible amount of data for complex systems research. Using GPS location tracking, check-ins on apps like Foursquare, geocaching from Twitter posts, and, under some circumstances, call data records from cell phones, they are able to find patterns in human mobility, traffic, and disease progressions with greater accuracy and precision than ever before. But the amount of data available also means that the burgeoning field of complex systems can be overwhelmed without some constraints.
“You’re going from orders of tens and hundreds of data points to orders of millions and billions,” Ghoshal says. “When you have this change of scale, the simple ways of drawing diagrams don’t work; you need laws to dictate how the data interact.”
That’s where physics enters the picture.
The physics of complex systems
In a series of papers in Physics Reports and Nature Communications, Ghoshal and members of his lab used science to untangle complex systems and networks. Their work extends to three main branches: human dynamics and behaviors; urban systems and city science; and social networks. Applying the universal rules of physics and mathematics, they are able to build foundational models onto which other researchers—such as economists or city planners—can introduce more complex variables.
“There are differences between the way a physicist looks at a problem compared to a computer scientist,” says Hugo Barbosa, a post-doctoral researcher in Ghoshal’s lab, whose PhD is in computer science. “Physicists are more interested in the fundamental rules, the things that are universal, regardless of the populations. They want to understand the basic components of those models and make those components as general and universal as possible.”
Imagine, for instance, you want to figure out how people walk on a campus. One way of approaching this problem would be to gather all the data possible about every single person on the campus: what they ate that morning, what classes they have at what times, who their friends are, where the buildings are located on the campus, and so on.
“It would, first of all, be virtually impossible to collect all this data,” Ghoshal says, “plus you wouldn’t be able to apply the same conclusions to the ways people walk on other campuses. The buildings are different, the geography is different.”
A second way of approaching the problem involves using the methods Ghoshal and his lab members employ: distilling a system to it basics and applying physics, mathematics, and statistics.
There are a few essential factors that apply to almost all cases in which people move about. People want to move in some direction (what physicists call drift velocity). They don’t want to bump into other people, or into buildings or other objects—demonstrating what’s known as repulsive potential.
They may seem simple, but with just these basic elements, “I can more or less reproduce the pedestrian behavior of people anywhere on the planet,” Ghoshal says. “There are many things that come into play such as cultural factors, but now you have a foundation to build upon, contained within these essential factors.”
The number of people moving from location A to location B, for example, also turns out to be inversely proportional to the distance squared, which is similar to a gravitational force. The flow is dependent on distance (the longer you have to travel, the less likely you are to travel), but is also a function of the population, which is akin to mass, Ghoshal says. “Sometimes, the way physicists think about dust particles moving in a room can be similarly applied to humans.”
Applying physics to ICT data
Ghoshal’s current research applies rules of physics to urban systems and cities using Information and Communication Technology (ICT) data. The data allows his group to uncover patterns in the organizational structure of cities, as well as the dynamics of human movement and its effects on land use, transportation design, the spreading of epidemics, socioeconomic indicators, and sustainability. Researchers must sign nondisclosure agreements to use the data and there are layers of privacy and encryption, so it’s impossible to trace data points to any one specific person. Data might include geotag stamps on a Tweet that indicate the geographic location of the tweeter, census data that indicates where people have migrated, and GPS data that show how fast a car reached its intended destination and which route the driver chose—shortest distance, less traffic, more scenic, and so on.
One project, conducted by Surendra Hazarie, a PhD student in physics, uses the data to look at segregation patterns in cities, along lines of income, race, or other characteristics. “By looking at the ways populations flow around cities in the different regions, we can examine the way those populations are split up in important ways,” he says. “Maybe wealthier communities tend to box themselves in and things like that.”
Ghoshal and other members of his group use ICT data to develop specific metrics that define how urban residents navigate a city. Their “inness metric,” for instance, shows how when people navigate a city, they tend to gravitate toward the socioeconomic center. The researchers found that the inness factor tightly correlates with the level of a city’s socioeconomic development, infrastructure development, and death and mortality rates. High levels of inness often accompany low levels of development because cities in the process of developing only have one city center. Conversely, well-developed cities have multiple socioeconomic centers, and the inness tends to be low or statistically insignificant.
“The presence or absence of this ‘attractive force’ serves as a historical indicator of a city’s development,” Barbosa says. ”Simply by looking at how the residents of a city sample a city tells you a lot about the city’s organization and how developed it is, at least from an infrastructural sense.”
Another metric is the “betweenness centrality.” To be central is to be between a lot of things. For instance, if you are in an area that falls between many routes—say the Twelve Corners area in Brighton, near Rochester, or a traffic circle in Washington, D.C.—there will be a higher betweenness centrality. Counterintuitively, with increased connectivity—whether through more roads, bike paths, or neurons in the brain—the flow of people and information develops a spatial dependence and congestion develops toward the city center. The implication is that metropolitan areas are better served building multimodal transportation systems that allow for various forms of transportation, rather than merely building more roads.
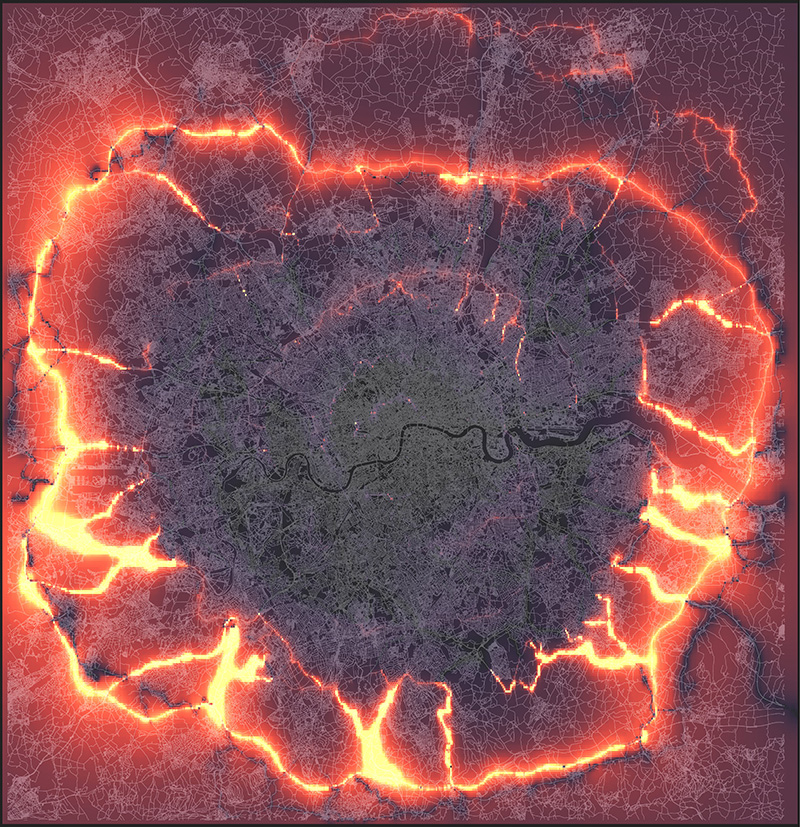
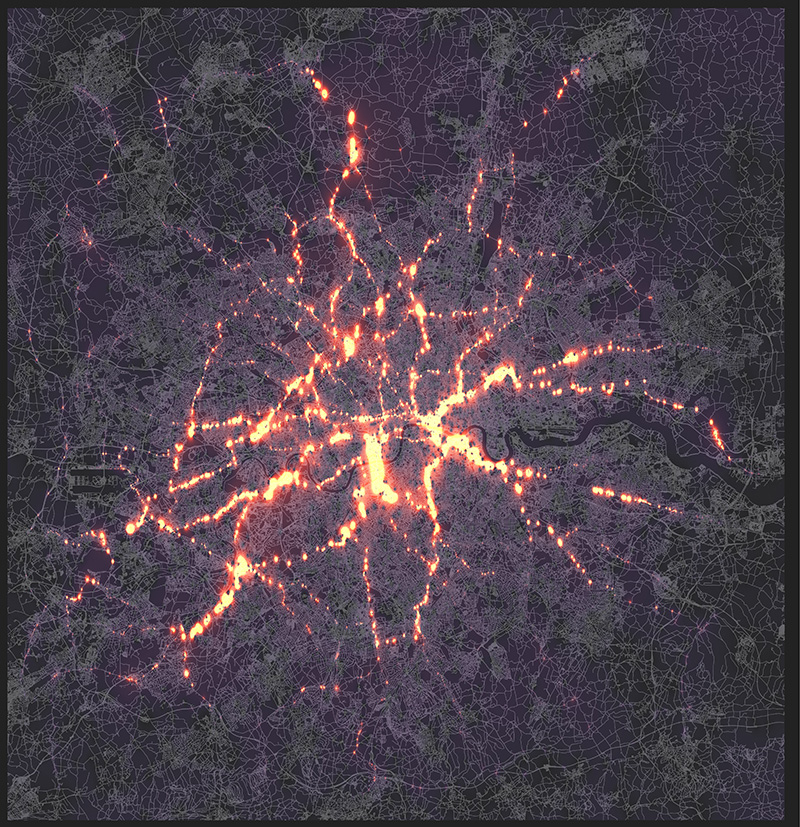
The two figures above show the betweenness centrality and inness profiles for the city of London. The betweenness centrality (left) illustrates high-congestion streets with potential traffic bottlenecks. The inness metric (right), on the other hand, highlights infrastructure surrounding the city, diverging the flow of traffic outward from the congested city core, rather than through it. (University of Rochester images / Gourab Ghoshal)
Interdisciplinary partnerships
Factors like inness and betweenness can help inform city planners by giving them building blocks that can be applied anywhere in the world. The ultimate goal, however, is not to completely overhaul existing cities or structures, Barbosa says. “It’s more about how can we leverage this knowledge to, for example, improve the synchronization of traffic lights and diverge the flow of people to a different area of the city if there is an accident? How can we foster and promote reducing segregation? How can we help prevent the spread of diseases in existing airports or hospitals?”
To this end, Ghoshal and his lab members partner with researchers in disciplines across the University. Kristin Bush, a PhD student in translational medicine, is co-advised by Ghoshal and Martin Zand, a professor of medicine at the Medical Center. Bush uses anonymous amalgamated data from electronic health records to construct hospital mobility networks. Using these networks, she hopes to develop a “risk metric” for the spread of C. Dificile bacteria infections in hospital wards.
“Understanding how people and locations are connected and analyzing those relationships through network centrality helps inform my predictive models in ways that would not have been possible using traditional statistical methods,” Bush says. “Network science changes the way we view patient movements in the hospital and helps us develop tools to improve patient outcomes and reduce the spread of infection.”
Ghoshal and his group are also working with Ehsan Hoque, the Asaro-Biggar (’92) Family Assistant Professor of Computer Science, and his Human Computing Interaction Group to analyze the efficacy and formation of teams performing specific tasks, leveraging Hoque’s public speaking tool RocSpeak.
Other future projects include mapping the after-effects of disease, such as the movement of people in Africa after the Ebola crisis or the effects of conflict in Syria on cross-border movement. Applying physical principles and involving researches from different domains can provide important insights, Ghoshal says: “Recently, we reached an important milestone: over half the global population now resides in urban centers, and this trend is expected to continue exponentially. Understanding what makes urban systems tick and how to make them sustainable is perhaps one of the most important questions of the 21st century. The only way to tackle such a complex problem is to combine the tools, trades and insights from a variety of research backgrounds.”
ScienceBlog.com has no paywalls, no sponsored content, and no agenda beyond getting the science right. Every story here is written to inform, not to impress an advertiser or push a point of view.
Good science journalism takes time — reading the papers, checking the claims, finding researchers who can put findings in context. We do that work because we think it matters.
If you find this site useful, consider supporting it with a donation. Even a few dollars a month helps keep the coverage independent and free for everyone.