

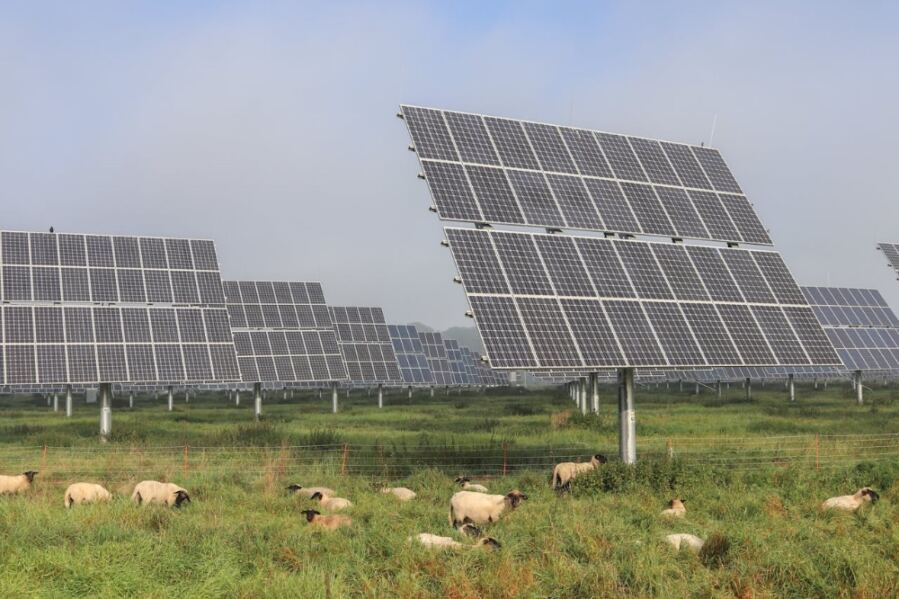
The story the headlines tell is a familiar one: local residents furious, farmland threatened, planning meetings turned battlegrounds, the clean energy transition stalling in a thicket of protest signs and injunctions. Read the news coverage of large-scale solar in America and you’d be forgiven for concluding that every field of panels has a fight behind it. Juniper Katz had a different suspicion. An assistant professor of public policy at the University of Massachusetts Amherst, she kept noticing the same disconnect: blanket coverage of conflict, and almost no systematic evidence about how common conflict actually was. “All I saw in the news was conflict, conflict, conflict over solar,” she says. “But there was really very little research that operationalized what conflict means and looked at it from a national scale to understand if the appearance of conflict was as prevalent as it seemed.”
So she and her colleagues decided to count. The results, published in Energy Research & Social Science, are rather more reassuring than the news cycle suggests, and considerably more complicated than either side of the renewables debate tends to acknowledge.
The team assembled a database of 686 utility-scale solar facilities that came online between January 2022 and November 2023, then built what they call a conflict-attention index for each one: a score combining the volume of news coverage, presence on social media platforms, and whether conflict-related language (words like “lawsuit,” “opposition,” “protest”) appeared in that coverage. It’s not a perfect instrument, the researchers are quick to admit. Manual social media searches introduced potential variation; a deliberately lean ten-word conflict lexicon might miss disputes couched in different language; and crucially, the sample only includes plants that actually got built. Projects cancelled midway through (possibly the most contentious ones) are invisible to this method, which means the true conflict rate is probably somewhat higher than what the data show.
Conflict Is the Exception, Not the Rule
Even so, the picture that emerges is striking. Fifty-six percent of the 686 projects showed no or low conflict-attention. Just 19% landed in the high-conflict category. That 19% figure is notably above what earlier research had estimated (a 2023 study using the same methodology found only 4% of projects in the high-conflict bucket), but it is a long way from the crisis narrative that dominates coverage. Conflict happens. It’s real and it has costs, including delays, financing difficulties, and a dampening effect on developers’ appetite for future projects. But it is not, on this evidence, the norm.
One of the study’s more counterintuitive findings concerns who actually opposes these projects. Wind energy research has built up a fairly consistent picture over decades: opposition concentrates in wealthier, whiter, more Democratic-leaning communities, with organised, resource-rich residents more likely to show up to hearings, file petitions, and block development. The solar picture looks different. Democratic vote share showed no statistically significant relationship with conflict levels. Higher-income areas were actually associated with modestly lower conflict, not higher. Communities with larger shares of Black and Hispanic residents were more likely to fall into the no-conflict category. “We shouldn’t just assume that all renewable energy is the same in terms of how it gets from conception to build-out,” Katz notes.
Why might solar behave differently from wind? The study doesn’t test mechanisms directly, but one plausible explanation is the visual profile of the technology. Wind turbines are tall, moving, audible, and can dominate a rural skyline for miles. Solar arrays, by contrast, sit low and largely silent. The amenity communities most likely to mobilise against infrastructure they can see and hear from their properties may simply have less to object to. Perhaps. It’s worth noting that the study’s authors are cautious about causal inference throughout, describing their findings as a starting point rather than a verdict.
Where Projects Go to Avoid a Fight
The strongest predictor of whether a solar project stays out of the conflict-attention data isn’t local politics, or demographics, or even community wealth. It’s something more structural: who gets to say yes or no in the first place. Projects permitted under state-level authority were roughly 17 percentage points more likely to show up in the no-conflict category than those approved under other arrangements, and about 9 percentage points less likely to land in the high-conflict group. The United States runs on a patchwork of permitting arrangements, with some states reserving siting authority centrally, others delegating to counties and municipalities, and many operating hybrid or contingent systems that trigger different processes depending on project size. Developers, in a separate survey by Lawrence Berkeley National Laboratory, consistently rank local zoning disputes as their leading cause of multi-year delays, ahead of grid interconnection queues, supply chains, and environmental review.
The researchers are careful to resist the obvious policy conclusion here. State permitting might produce fewer visible conflicts because state processes offer clearer procedural timelines and less opportunity for veto. Or it might be that state processes simply provide fewer venues for public participation, meaning opposition never gets the foothold it needs to show up in a news search. The data can’t distinguish between these interpretations, and the difference matters enormously for anyone thinking about how permitting reform should be designed.
Project size also matters, in the direction you’d expect. Moving from a small facility (around the 25th percentile of the sample’s capacity distribution) to a large one (75th percentile) more than doubled the probability of falling into the high-conflict-attention category. Bigger installations demand more land, create more visible infrastructure, and tend to generate more anxiety about who benefits and who absorbs the disruption. This finding echoes both the wind literature and prior solar case studies.
Media, Perception, and What Gets Counted
There is a feedback loop at the heart of this study’s subject matter. Conflict generates news coverage. News coverage shapes the perception that conflict is everywhere. That perception then feeds into policy debates, funding decisions, and developer caution in ways that are genuinely hard to disentangle from the underlying reality. The researchers suspect this loop may have inflated the conventional wisdom about how contested solar development really is, in the same way that case-study research tends to draw its examples from the fights worth writing about rather than the permits quietly approved.
The AI data-centre boom has given this question some urgency it didn’t have before. Electricity demand is climbing, utility-scale solar added 22.5 gigawatts in 2023 (a 77% jump over the prior year), and the theoretical pathway to a renewable transition requires something in the range of 1.6 terawatts of solar capacity by 2050, which translates, roughly, to four or five million acres of land. As federal support for clean energy has become less reliable, the question of how state and local governments manage that land-use pressure is becoming more pressing. Getting a cleaner read on where real conflict is concentrated, rather than where it generates the most noise, seems like a reasonable place to start.
The researchers acknowledge the work is preliminary: a snapshot of two years, one methodology, no cancelled projects, and county-level demographics standing in for neighbourhood-level dynamics that might tell a quite different story. What it offers is a baseline. And the baseline, at least for now, suggests the solar backlash is louder in coverage than it is in practice.
https://doi.org/10.1016/j.erss.2026.104747
Frequently Asked Questions
Is public opposition to solar farms actually getting worse, or does it just seem that way?
It’s genuinely hard to tell from media coverage alone, which is partly what this study was trying to address. What the data show is that as of 2022-2023, most utility-scale solar projects that reached operation experienced little or no measurable conflict. Whether opposition is increasing over time would require a longitudinal study, and the researchers flag that their sample excludes cancelled projects, which may be where the most intense resistance lives.
Why does solar seem to generate less opposition in wealthier areas when wind energy does the opposite?
The study doesn’t pin down a mechanism, but researchers suggest the visual and acoustic profile of the technology probably matters. Wind turbines are tall and audible and can reshape a rural horizon in ways that affluent amenity communities tend to resist strongly. Solar arrays sit low and quiet, which may simply give those communities less to organise around. That said, this is inference, not something the data directly test.
Does state-level permitting actually reduce conflict, or does it just silence opposition?
This is exactly the tension the researchers flag. State permitting is associated with lower conflict in the data, but the study can’t determine whether that’s because state processes are genuinely better at managing disputes, or because they provide fewer venues for public participation. The difference has real implications for how permitting reform gets designed, and the authors say more research is needed before drawing prescriptive conclusions.
How much land does the US actually need to cover for a full solar transition?
The rough figure cited in the research is around four to five million acres per terawatt of installed capacity. A plausible decarbonisation pathway would require something like 1.6 terawatts of solar by 2050, which puts the total land requirement in the range of six to eight million acres. To put that in context, the US currently has around 900 million acres of farmland. How much of that transition lands on agricultural land, and how that’s governed, is increasingly where the conflict debate is heading.