

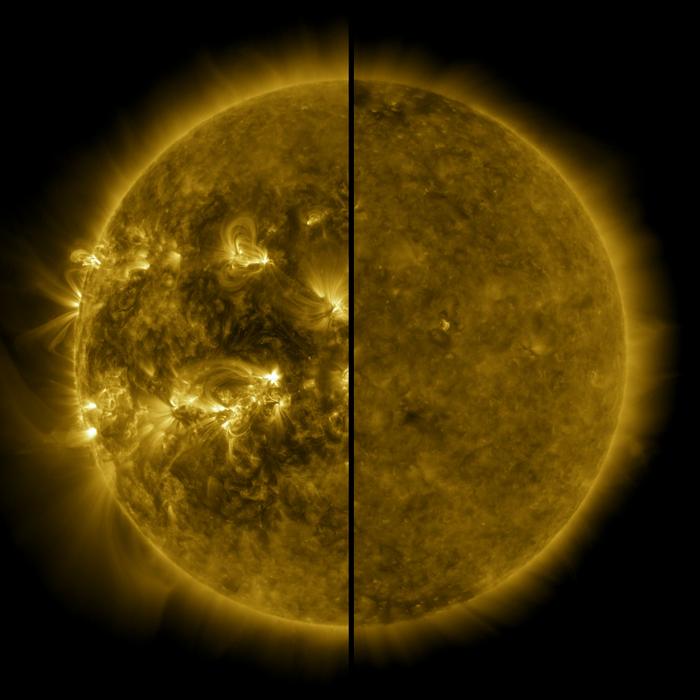
Six telescopes, spread across three continents, have been listening to the Sun for nearly four decades. Not to its light. To its sound. The Birmingham Solar Oscillations Network, or BiSON, tracks tiny pressure waves rippling through our star’s interior, the same way geologists read earthquake tremors to map what lies beneath the crust. And after almost 40 years of that quiet, patient listening, the data have turned up something that nobody quite expected: the Sun appears to be rearranging itself.
The finding, published this week in Monthly Notices of the Royal Astronomical Society, suggests that the Sun may be undergoing a long-term structural shift spanning multiple solar cycles, one that conventional surface-watching instruments would never have caught.
Solar activity waxes and wanes on an approximately 11-year cycle, swinging between periods of calm and stretches of intense magnetic violence that produce solar flares, coronal mass ejections and the geomagnetic storms that can, in bad cases, knock out GPS systems and power grids. The physical engine behind all of this sits deep beneath the visible surface, in layers of churning plasma where magnetic fields are generated and reorganised. Tracking what happens down there has always been the hard problem. Sunspots, radio emissions, ultraviolet output: all of these are proxy measures, surface shadows of interior processes that remain otherwise hidden from view. The BiSON network approaches this differently. By measuring how the frequencies of internal sound waves shift as the Sun’s magnetic activity rises and falls, researchers can effectively take the star’s pulse from the inside.
What they found, when they sorted those oscillations into low-, mid- and high-frequency bands, is that the interior picture and the surface picture are increasingly telling different stories.
The key clue came from the current solar cycle, Cycle 25. In the conventional surface indicators, sunspot numbers and 10.7-centimetre radio flux, Cycle 25 looks somewhat weak, roughly 25 percent weaker at its peak than Cycle 22, which ran from 1986 to 1996. But in the high-frequency seismic band, the one sensitive to structural changes in the outermost 1,000 kilometres or so beneath the surface, Cycle 25 looks just as strong as those earlier, more active cycles. Something is happening close to the top that the sunspot count simply isn’t picking up.
Professor Bill Chaplin, of the University of Birmingham and lead author of the study, describes it as the Sun having “its own ‘active biorhythm’ creating rising and falling magnetic activity that shapes space weather,” adding that “traditional surface measures don’t capture the full story, that the Sun may be entering a different mode of behaviour unfolding over decades.” His co-author Professor Sarbani Basu, from Yale University, is more blunt about what can’t explain it: “This trend cannot be explained simply by weaker magnetic fields. Instead, it indicates a structural reorganisation of how the Sun’s magnetic activity is stored beneath the surface.”
The pattern the team uncovered is one of progressive confinement. In Cycle 22, structural changes associated with the solar cycle were distributed through relatively deep interior layers. By Cycle 23, the low-frequency oscillations, which probe deeper regions, started behaving differently from the surface proxies, a divergence the team noticed in an earlier study and have now confirmed persists through Cycle 25. Over that same span, the mid-frequency modes, sensitive to intermediate depths, have become progressively less responsive to surface activity. And now, in Cycle 25, the high-frequency modes, those shallow-layer probes, are going anomalously strong. Taken together, the picture is of magnetic structural activity being squeezed upward, cycle by cycle, into an ever-thinner shell just beneath what we can see. As Chaplin puts it, “magnetic activity is becoming more tightly confined near the surface with each cycle,” and crucially, this is “the first such discovery.”
This matters, perhaps quite a lot, for space weather forecasting. Current prediction models are built on the assumption that surface indicators reliably represent what the Sun’s interior is doing. If that assumption is crumbling, then a cycle that looks quiet from the outside could be generating subsurface structural stress that simply isn’t being counted. It’s a bit like judging a thunderstorm by how much rain you can see from a window, when the real action is offshore.
Independently, other research groups have noticed their own multi-decade trends in near-surface solar behaviour, including a systematic decline in the number of spots per sunspot group across Cycles 21 through 24, and possible changes in average sunspot field strength. The BiSON result fits into that emerging picture, though what it all adds up to is not yet clear.
The team speculates, cautiously, that the changing relationship between interior oscillations and surface activity might be tied to the 22-year Hale cycle, the longer period on which the Sun’s magnetic polarity fully reverses and returns. If so, it could be part of a deeper oscillation in solar behaviour that only becomes visible when you have enough decades of data to see it. BiSON has been running since 1987, which is just barely enough. Continued observations through the rest of Cycle 25 and into the upcoming Cycle 26 will be essential to finding out.
For now, what the data show is that the Sun, the star we’ve been staring at since the first humans looked up, is still capable of surprising us. Not with a flare or an ejection but with a slow, interior rearrangement, hidden beneath the surface, audible only to those who think to listen.
https://doi.org/10.1093/mnras/stag847
Frequently Asked Questions
What is helioseismology and how does it work?
Helioseismology uses sound waves that naturally propagate through the Sun’s interior to probe structures that are otherwise completely invisible. These pressure waves, called p-modes, cause the entire star to oscillate, and their frequencies shift depending on the magnetic and thermal conditions the waves pass through. By measuring those frequency shifts over time, researchers can infer what the interior looks like, much the way seismologists read earthquake waves to map Earth’s layers.
Why do the surface indicators and internal seismic data tell different stories for Cycle 25?
Surface indicators like sunspot numbers measure the visible magnetic output at the photosphere, the layer we can see. The high-frequency seismic modes, by contrast, are sensitive to structural changes in a thin shell roughly 1,000 kilometres beneath that surface. The emerging picture is that magnetic activity is becoming concentrated in this shallow layer, registering strongly in the seismic data while appearing weaker to conventional surface measurements. Whether this represents a stable new regime or a transitional phase is something the researchers are still working to determine.
Could this shift affect space weather predictions?
Possibly, yes. Most operational space weather models rely on surface proxies, things like sunspot counts and radio flux, to forecast the intensity of upcoming solar activity. If those proxies are increasingly underestimating what’s happening in the shallow subsurface, the models could be miscalibrated. The research team hasn’t yet quantified the forecasting implications, but it’s one of the reasons the finding is considered significant beyond pure solar physics.
What is the Hale cycle and why might it be relevant?
The better-known solar cycle is about 11 years long, the time between successive sunspot maxima. But the Sun’s magnetic polarity actually reverses each cycle, meaning it takes roughly 22 years, two 11-year cycles, for the Sun to return to its original magnetic orientation. This is called the Hale cycle. The BiSON team speculates that the progressive confinement of magnetic activity they’ve detected might be part of a longer rhythm operating on Hale-cycle timescales, though confirming that will require at least another decade of data.
How long has BiSON been running and why does that matter?
The Birmingham Solar Oscillations Network has been collecting data continuously since 1987, giving researchers a dataset that now spans almost four complete solar cycles. That longevity is what makes the finding possible. The structural shift the team detected is a gradual, multi-decade trend, not something that would be visible in a few years of observation. Without that long baseline, the divergence between seismic modes and surface proxies would look like noise rather than signal.