Skip to content
ScienceBlog.com
  • Featured Blogs
    • EU Horizon Blog
    • ESA Tracker
    • Experimental Frontiers
    • Josh Mitteldorf’s Aging Matters
    • Dr. Lu Zhang’s Gondwanaland
    • NeuroEdge
    • NIAAA
    • SciChi
    • The Poetry of Science
    • Wild Science
  • Topics
    • Brain & Behavior
    • Earth, Energy & Environment
    • Health
    • Life & Non-humans
    • Physics & Mathematics
    • Social Sciences
    • Space
    • Technology
  • Our Substack
  • Follow Us!
    • Bluesky
    • Threads
    • FaceBook
    • Google News
    • Twitter/X
  • Contribute/Contact

biodiversity

A digital illustration depicting a collage of various ecosystems, including forests, grasslands, and marine environments, with a graph overlay showing the projected decline in biodiversity over time due to land-use change and climate change.

Climate Change to Become Main Driver of Biodiversity Decline

Lionfish

Invasive Lionfish Rapidly Spreading in Mediterranean, Threatening Biodiversity

Scene of a pond with birds and other wildlife

The more diverse nature, the better it is for mental health

Multilevel, multisectoral solutions are needed to reduce climate-related immune diseases

Damaged Ecosystems Take a Toll on Our Health: Scientists Urge Action to Safeguard Our Future

Cnemaspis vangoghi

Starry Night Inspired Lizard Discovered in India

Bothriechis rahimi

Five dazzling new species of eyelash vipers discovered in Colombia and Ecuador

Artistic reconstruction of the Cabrières Biota

New fossil site of worldwide importance uncovered in southern France

Rhino

Southern Africa’s temps will rise past the rhinos’ tolerance

Kingo

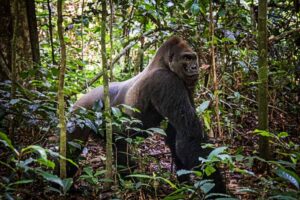
One of the World’s Most Iconic Lowland Gorillas, Kingo, of the Republic of Congo, Has Died of Old Age

Map of elephant population growth rates across southern Africa. Figure reproduced from Huang et al. 2024 (DOI: 10.1126/sciadv.adk2896)

Protected areas for elephants work best if they are connected

The upper panel depicts the coastal forest pre-tsunami, while the lower panel illustrates the forest post-tsunami. Each column represents the percentage decrease in coastal tree cover resulting from the tsunami event (1: no change, 5: 41-50%, 10: 91-100%). In cases where there was a 91-100% decrease in tree cover, indicated by the inset with the black frame in the bottom right image, nearly all trees were toppled by the tsunami. It is important to note that we magnified the satellite images/aerial photographs to assess the percentage decrease in coastal forest cover attributable to the tsunami event.

Mixed forests protect coastal areas from tsunami impacts better than monoculture forests

Ohio State logo

How technology and economics can help save endangered species

Tree in a wilderness scene

NASA Helps Study One of the World’s Most Diverse Ecosystems

Bird at night. Unsplash

Artificial light is luring birds to cities and sometimes to their deaths

Older posts
Newer posts
← Previous Page1 Page2 Page3 Page4 … Page7 Next →
Substack subscription form sign up

Comments

  • Karoly Mirnics on Common Prescription Drugs May Disrupt Cholesterol Pathways in the Womb and Raise Autism Risk
  • Aizen on Laziness helped lead to extinction of Homo erectus
  • Norwood johnson on Electrons in New Crystals Behave as If They Live in Four Dimensions
  • ScienceBlog.com on Hidden Geometry Could Finally Fix Quantum Computers
  • Theo Prinse on America Is Going Back to the Moon. This Time, It Plans to Stay
© 2026 ScienceBlog.com | Follow our RSS / XML feed