Key Takeaways
- Harvey Miller’s team at Ohio State University works to reconstruct erased Black neighborhoods in Columbus through the Ghost Neighborhoods project.
- They use detailed Sanborn fire insurance maps and community testimonies to create 3D models of lost neighborhoods.
- The project aims for accuracy and emotional resonance by incorporating community feedback and oral histories.
- Automated methods for processing maps could help recreate neighborhoods across the U.S. affected by urban renewal and highway construction.
- The models not only visualize the past but also honor community stories, emphasizing their belonging to the residents rather than the project.
A city is not just roads and buildings. It is the memory of what stood there before.
That sounds like something you’d read on a plaque. But for the residents of Columbus, Ohio’s Near East Side, it isn’t philosophy; it’s a grievance. Beginning in the mid-1960s, engineers drove the interstate highway system through some of the city’s most established Black neighborhoods, clearing blocks of homes, churches, barbershops and corner stores to lay down I-70 and I-71. What they left behind was, in many respects, still there: the elders who survived the demolitions, the Tuskegee Airmen who’d bought their Cape Cod homes in the Carver Addition and watched their community bisected by an off-ramp, the former residents of Poindexter Village who remember the layout of apartments that were torn down in 2013 after more than seven decades of use. These people remember, with startling precision, what was lost. The problem is that the buildings don’t.
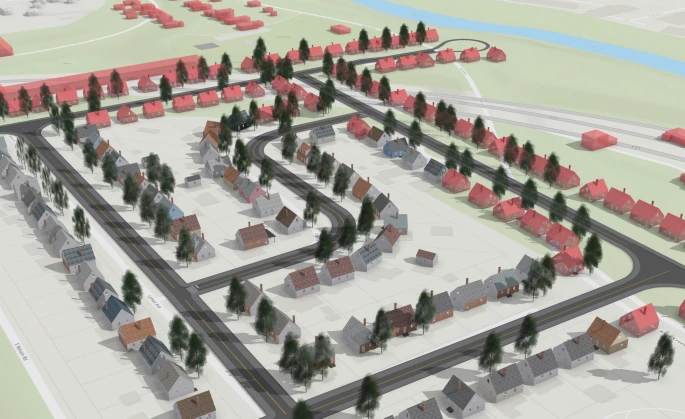
That gap between living memory and demolished brick is exactly what Harvey Miller and his colleagues at Ohio State University are trying to close. Their Ghost Neighborhoods of Columbus project, now five years running, has spent that time building something that sounds almost defiantly literal: a 3D model of the neighborhoods as they actually existed, populated with real buildings at real addresses, reconstructed from historical fire insurance maps and the testimony of the people who once walked those streets. The results, published this month in the International Journal of Digital Humanities, describe both a technical achievement and something harder to quantify: a reckoning with what cities do to the communities they erase.
The raw material for the project comes from an unexpected source. Sanborn fire insurance maps, produced from the 1860s through to the 1970s, covered more than 12,000 American cities and towns in extraordinary detail: building footprints, heights, construction materials, window counts per floor, roof types. Surveyors returned repeatedly over the decades, pasting correction slips directly onto earlier sheets to update what had changed. The Library of Congress holds roughly 700,000 of these maps, nearly 450,000 of which are freely downloadable. They were never intended as tools for urban memory; they were made for actuaries. But in aggregate they amount to something like a complete architectural census of 20th-century America, including the blocks that no longer exist.
Miller’s team developed machine learning methods to extract building data from the maps automatically: footprints, materials, floor counts, usage classifications. The algorithms still make small errors (jagged edges, missing interior partition lines, thin protrusions at building boundaries) that have to be cleaned up, and cleaning them up is laborious, building by building. Getting one city block’s worth of commercial buildings to LOD3 quality (meaning architecturally complete, with roofs and windows and doors) can take 700 hours of work. The Mount Vernon Avenue model, covering three city blocks of a once-busy commercial corridor, required roughly that. “Doing this in a community-engaged way is not trivial,” Miller said.
Urban highway planners in the 1950s and 60s frequently routed interstate highways through lower-income and minority neighborhoods because land was cheaper to acquire, political resistance was weaker, and these communities had less access to legal or institutional protection. In Columbus, neighborhoods like Hanford Village and the Mount Vernon Avenue corridor were already subject to redlining policies that restricted investment and made demolition easier to justify politically. The long-term economic consequences for displaced residents were severe and largely uncompensated.
Accuracy depends on the level of detail available. Where architectural plans survive (as with Poindexter Village) or historical photographs exist, buildings can be modeled with high fidelity. Where only the Sanborn maps are available, buildings are reconstructed to a reasonable standard but rendered with a grey, semi-transparent appearance to signal that direct evidence is limited. Community members, including former residents, have reviewed and corrected specific architectural details including rooflines, window placements, and interior layouts, which means the models incorporate local knowledge alongside documentary evidence.
In principle, yes. The Sanborn fire insurance maps cover more than 12,000 American cities and towns between roughly the 1860s and the 1970s, and nearly half a million of these maps are freely available from the Library of Congress. The Ohio State team is developing automated methods for extracting building data from these maps at scale, which would make it feasible to apply the same approach to other cities. The main bottleneck is the time required to build detailed 3D models, which the team is working to reduce through machine learning-based clustering and template generation.
The oral histories are being integrated directly into the 3D models as multimedia layers, accessible when users click on specific buildings in the digital environment. They will also feature prominently in the planned Poindexter Village African American Museum, due to open in 2028, which will include a dedicated space for the Ghost Neighborhoods project. The research team has been deliberate about treating the stories as belonging to the community rather than to the project.
In some cases, yes. The research team found that the VR experience of walking through a digitally reconstructed Poindexter Village produced strong emotional responses in elders who had actually lived there: feelings of both appreciation and loss. Following those sessions, the team introduced debrief conversations, including support from other community elders, to help participants process the unexpected emotional weight of the experience. The researchers view this as a necessary part of working responsibly with living memory.
That qualification matters. It would be straightforward enough to produce a technically accurate model and call it done. What the Ohio State team found was that technical accuracy alone made the models feel, in the words of community members who reviewed early versions, sterile. The first drafts of Mount Vernon Avenue showed buildings but no people, no cars, no street life. Elders who examined the models pushed back: this wasn’t what the neighborhood had felt like. The team went back and added vehicles, pedestrians, brick streetscapes, grass. They added the specific trees that appeared in 1940s aerial photography from the Ohio Department of Transportation, placed where the ODOT imagery showed them standing. Former residents of Poindexter Village corrected window placements and rooflines from memory.
Graduate student Tshui Mum Ha is leading the push to scale this process up. Rather than modeling buildings one at a time, her work focuses on grouping buildings by shared characteristics (shape, height, materials, interior layout) to generate templates that can be applied procedurally across dozens or hundreds of structures. “Many existing studies have been using just the exterior walls of the buildings for clustering,” Ha explained. “We realized that including semantic attributes of those building footprints is a huge improvement compared to just looking at the exterior walls.” Interior partition lines, it turns out, matter too: a duplex has two front doors, symmetric window patterns, firewalls between units. A model that ignores those lines gets the facade wrong.
The ambition behind all of this is to make the modeling fast enough that it can happen in conversation with the community, not after the fact. At present, updating a model based on elder feedback takes weeks. Miller’s vision is to shorten that to minutes: to sit with a resident at a laptop, pull up a building, and modify it on the spot in response to corrections. “Not too far in the future, we expect to be able to take a laptop with 3D models, ask people, ‘What do you think about this building?’ and make adjustments on the spot,” he said. That may sound optimistic, but it’s a reasonable extrapolation of where the technology is heading. Generative AI models are already beginning to produce 3D architectural geometry from sketches and annotated images; incorporating Sanborn map data into that pipeline is plausible.
What gives the project its weight, though, isn’t the technology. It’s the history underneath. The George Washington Carver Addition in Hanford Village was developed in 1946 and marketed specifically to Black veterans returning from World War II; many of the original homeowners were Tuskegee Airmen, stationed nearby at Lockbourne Army Airfield after the war. In the current 3D model, the demolished buildings are rendered in red against the grey ribbon of I-70. Poindexter Village, dedicated by Franklin D. Roosevelt in 1940 as one of the first public housing communities in the country, and the only one dedicated to Black residents in Ohio, now survives in just 2 of its original 35 apartment buildings. The model reconstructs all of them. The VR experience of walking through the reconstruction prompted, according to the research team, a strong feeling of appreciation and loss in elders who’d actually lived there; the team found it necessary to plan emotional support sessions after those demonstrations.
Shelbi Toone, project director for the planned Poindexter Village African American Museum and a co-author of the paper, has been central to connecting the research team with the communities whose history is being digitized. “There’s a lot of narrative to tell when you pull back to 1940 and really talk about the thriving neighborhood that used to be there,” she said. “I think it gives people a true sense of preservation and understanding of what was here through the technology since so many of these buildings have turned over, been demolished or changed.” The museum, due to open in 2028 in the two surviving Poindexter buildings, will include a dedicated room for the Ghost Neighborhoods models.
There’s something worth noting about the project’s scope beyond Columbus. If the team’s methods for automated Sanborn map processing become fully scalable, the implications are considerable. Those 700,000-odd maps in the Library of Congress represent every kind of American city across a century of transformation, including thousands of neighborhoods that, like Columbus’s Near East Side, were reshaped or erased by postwar highway construction and urban renewal. The data locked in those maps, once extracted, could support research on urban heat islands, housing equity, historical disease patterns, and the long-term economic consequences of redlining, among much else. It is, in that sense, not just an archive of what was demolished. It is evidence.
Miller keeps returning to something simpler than the technical argument, though. The stories being collected from Poindexter Village elders, the oral histories, the corrections of window placements and rooflines: these belong to the community. “One important thing is that we’re trying to establish a platform for people in the community to tell their stories,” he said. “They’re not our stories. They’re theirs.” The models are vessels, not conclusions. What fills them is still being gathered from the people who lived there and still remember.
Source: https://link.springer.com/article/10.1007/s42803-026-00122-2
ScienceBlog.com has no paywalls, no sponsored content, and no agenda beyond getting the science right. Every story here is written to inform, not to impress an advertiser or push a point of view.
Good science journalism takes time — reading the papers, checking the claims, finding researchers who can put findings in context. We do that work because we think it matters.
If you find this site useful, consider supporting it with a donation. Even a few dollars a month helps keep the coverage independent and free for everyone.