For decades, a global climate model saw the planet the way an early digital camera did: about ten thousand pixels stretched across the entire Earth. At that resolution a monster thunderstorm cluster, the kind that drowns cities and snaps power lines, showed up as a smudge. You couldn’t tell its shape, how long it churned, or where it dropped its heaviest load of rain. So the models guessed. They leaned on rough stand-ins called convective parameterizations, and those stand-ins had a habit of getting things badly wrong, conjuring endless light drizzle while missing the real downpours entirely.
That blind spot mattered more than it might sound. The organised clusters those old models couldn’t see, known to atmospheric scientists as mesoscale convective systems, or MCSs, are the very things behind most flash floods, damaging winds and record-breaking rain.
Now the picture has sharpened, dramatically. A new generation of “kilometer-scale” models has leapt to more than 50 million pixels per global layer, roughly 2.8 km of resolution, fine enough to watch individual storm updrafts and rainbands form without any guesswork at all. Which raises the obvious question, the one that keeps disaster planners awake: with weather turning more violent as the climate warms, do these gorgeous new simulations actually get storms right?
To find out, an international team led by the Chinese Academy of Meteorological Sciences, Beijing Normal University, ETH Zurich and the CAS Institute of Atmospheric Physics did something that had never been done before. They took six of the world’s leading global kilometer-scale models, ran them for an entire year, and pointed them all at the same brutal exam: East Asia’s record-shattering summer of 2020.
A summer built for stress-testing
What a summer to pick. That year, the rain simply would not stop. Ten Chinese provinces flooded. Japan caught 1,000 mm in three days. South Korea’s rainy season dragged on for 54 days, well past its usual 32. If you wanted a real-world torture test for a storm model, you could hardly design a crueller one.
The models, a who’s who of the field, included the ECMWF’s IFS, the Max Planck Institute’s ICON, the UK Met Office’s UM, the US Department of Energy’s SCREAM, the University of Tokyo’s NICAM and the Chinese Academy of Sciences’ CAS-ESM. The team checked each one against what satellites had actually seen that summer, using an updated algorithm to track every storm cluster as it formed, swelled, travelled and died.
The verdict, on the whole, was encouraging. “The good news: these models mostly get the big picture right, where MCS rain falls, how long storms last, how fast they move, and their daily timing,” says Xiaotong Huang, the study’s first author and an M.Sc. candidate at the Chinese Academy of Meteorological Sciences. The simulations reproduced the broad geography of where the storms unloaded, tracked their daily rhythm, and even captured the eastward march of rain spilling off the Tibetan Plateau. Individual models had their party tricks, too: IFS nailed the spatial pattern of rainfall, NICAM the size of the storms, SCREAM the way intensity shifts between land and sea.
The same four mistakes, again and again
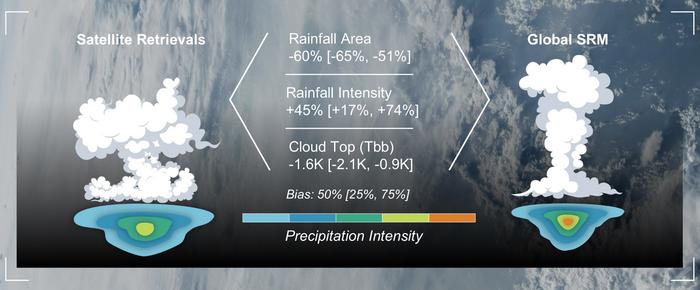
And yet. For all their resolution, every single model made the same handful of errors, which is itself a telling thing. “They produce too many MCSs, which are too short-lived, too small in area, and too intense in rainfall rate,” says Puxi Li, the study’s corresponding author. Too many storms, each one too brief, too cramped, too fierce. The simulated cores burned hotter and tighter than anything the satellites saw: a downpour squeezed into too small a footprint, hammering down harder than reality ever managed.
That four-part fingerprint, shared across models built by entirely different teams on entirely different continents, is the most useful thing in the whole study. When independent models all stumble in exactly the same way, the problem isn’t a bug in any one of them; it points to something deeper, some shared gap in how all of them handle the small-scale physics of clouds.
None of this is a tidy academic puzzle. In late May 2026, extreme rain battered the middle and lower reaches of the Yangtze, and China’s water and weather authorities jointly issued the year’s first national-level red alert for torrential rain and flash floods. An earlier study by the same group had already found that MCS-linked rainfall now accounts for more than 75 per cent of the total increase in rain along the East Asian summer monsoon rainband over the past two decades, a trend they tie directly to a warming world. The storms are getting worse, and we are still learning to draw them.
Still, a milestone is a milestone. Running multiple kilometer-scale models for a full year was, until recently, the stuff of wishful thinking; under European initiatives such as nextGEMS, WarmWorld and Destination Earth, models like ICON and IFS have now managed continuous integrations spanning decades. The remaining work, which the field will thrash out at the KM-scale Global Modelling Summit in Hamburg later this year, comes down to the fiddly business of clouds: refining the microphysics, the turbulent churn of the boundary layer, the handshake between atmosphere, ocean and land. Get those right, and the goal the authors keep circling back to comes within reach, putting the right storm in the right place at the right time, and turning these 50-megapixel dreams into something that actually helps a city brace before the water rises.
Source: Huang, X., Li, P., Yu, H. et al. “Storm-Resolving Earth: How Well Do Global Kilometer-scale Models Simulate Storms in East Asia’s 2020 Record-breaking Wet Summer?” Advances in Atmospheric Sciences (2026). https://doi.org/10.1007/s00376-026-5756-7
Frequently Asked Questions
Why does it matter that all six models made the same mistakes?
When models built by separate teams in different countries fail in identical ways, the problem almost certainly isn’t a coding error in any one of them. It points to a shared blind spot in how the entire field handles small-scale cloud physics, which is exactly the kind of clue that tells researchers where to aim their next round of improvements.
What is a mesoscale convective system, and why should I care?
It’s a large, organised cluster of thunderstorms that can stretch for hundreds of kilometers and last many hours. These systems are responsible for most flash floods, damaging winds and record rainfall, which is why getting them right in a climate model is the difference between a useful flood warning and a missed one.
If the models are so detailed now, why can’t they nail the rainfall exactly?
Resolution gets you most of the way, but not all of it. Even at 2.8 km, a model still has to approximate the messiest small-scale processes inside clouds, and that’s where the simulated storms drift from reality, packing their rain into cores that are too small and too intense.
Could these models actually improve flood preparedness?
That’s the whole point of the exercise. The authors frame their goal as getting the right storm in the right place at the right time, which would let cities and emergency services act on far more reliable forecasts. The biases identified here are essentially the to-do list standing between today’s simulations and that future.
ScienceBlog.com has no paywalls, no sponsored content, and no agenda beyond getting the science right. Every story here is written to inform, not to impress an advertiser or push a point of view.
Good science journalism takes time — reading the papers, checking the claims, finding researchers who can put findings in context. We do that work because we think it matters.
If you find this site useful, consider supporting it with a donation. Even a few dollars a month helps keep the coverage independent and free for everyone.